Market structure is simply the way price creates highs and lows as it moves across the chart.
Before learning Order Blocks, Fair Value Gaps, CISD, liquidity sweeps, or entry models, a trader should understand one basic question:
Is price actually moving higher, moving lower, or failing to continue in its current direction?
Market structure helps us answer that question.
For this lesson, we will build everything from the beginning.
We will learn:
What a swing high and swing low are
What HH, HL, LH, and LL mean
What bullish and bearish structure look like
What a valid Break of Structure is
Why a wick through a swing is not BOS
What protected highs and lows are
When a swing actually becomes protected
What a valid pullback is
What a valid high and valid low are
How to recognize failed continuation
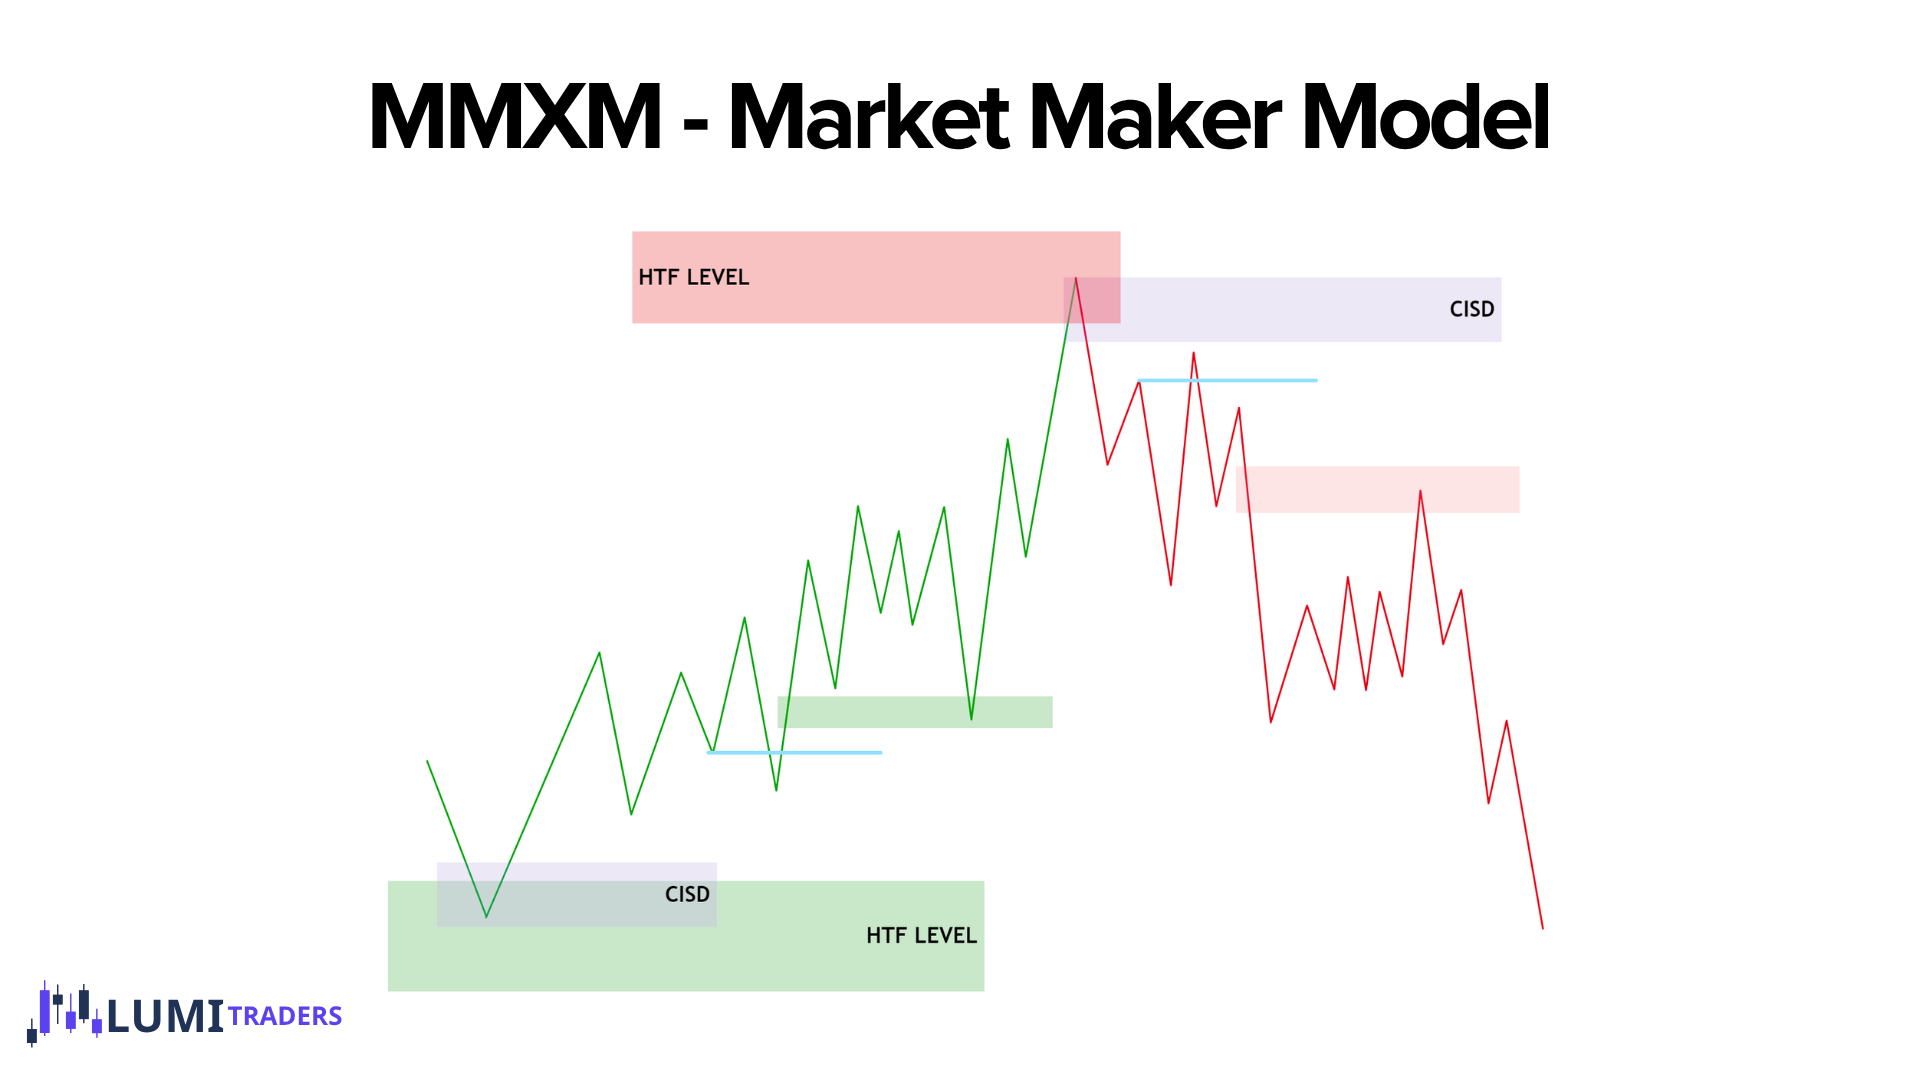
Why failed continuation can send price toward opposite liquidity
What we expect after BOS
How OTE fits into continuation
How to map structure correctly without labeling every small candle
What Is Market Structure?
Price does not usually move in a perfectly straight line.
Even when the market is strongly bullish, price normally moves like this:
Move higher → pull back → move higher → pull back → move higher
And in a bearish market:
Move lower → retrace higher → move lower → retrace higher → move lower
Those movements create highs and lows.
Market structure is the relationship between those highs and lows.
4 Basic Structural Points
There are 4 terms we need first:
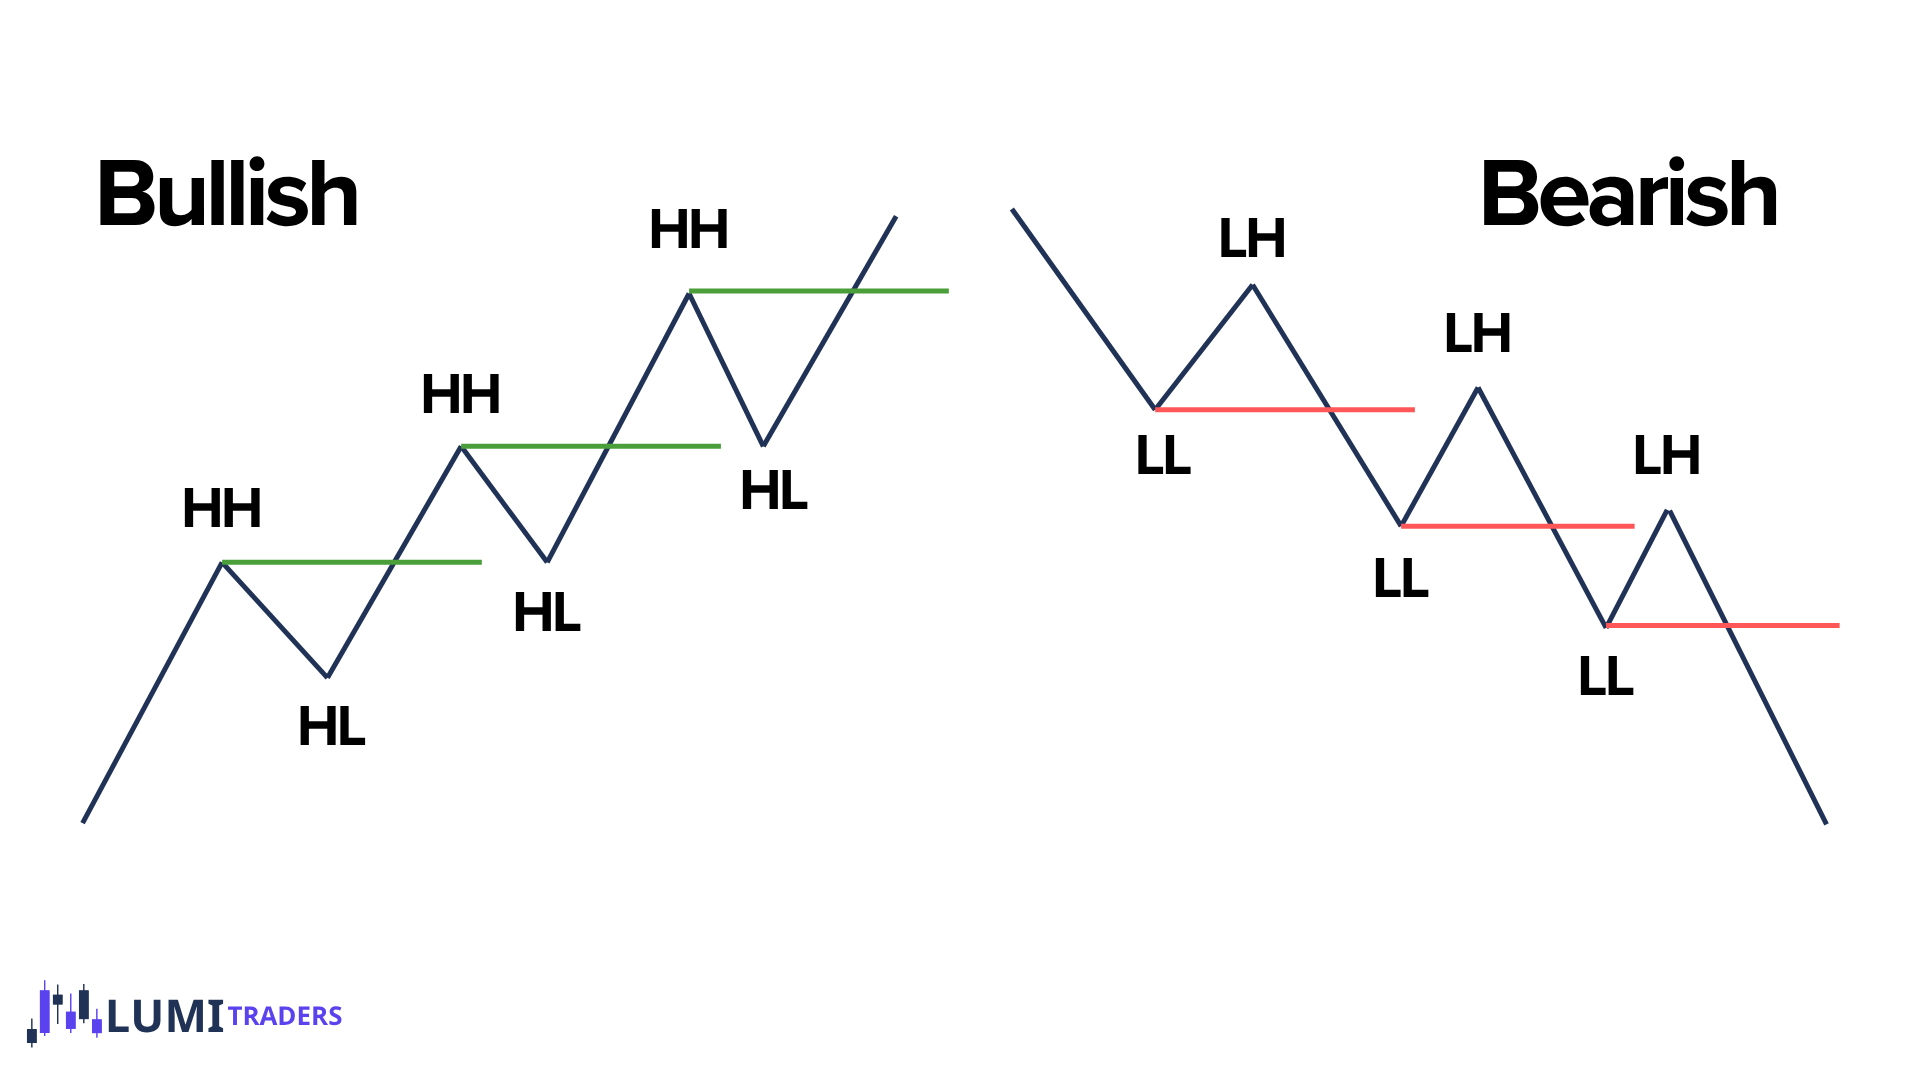
Higher High — HH
A new high above the previous important high.
Higher Low — HL
A pullback low that remains above the previous important low.
Lower Low — LL
A new low below the previous important low.
Lower High — LH
A retracement high that remains below the previous important high.
These four points create bullish and bearish trends.
Bullish and Bearish Market Structure
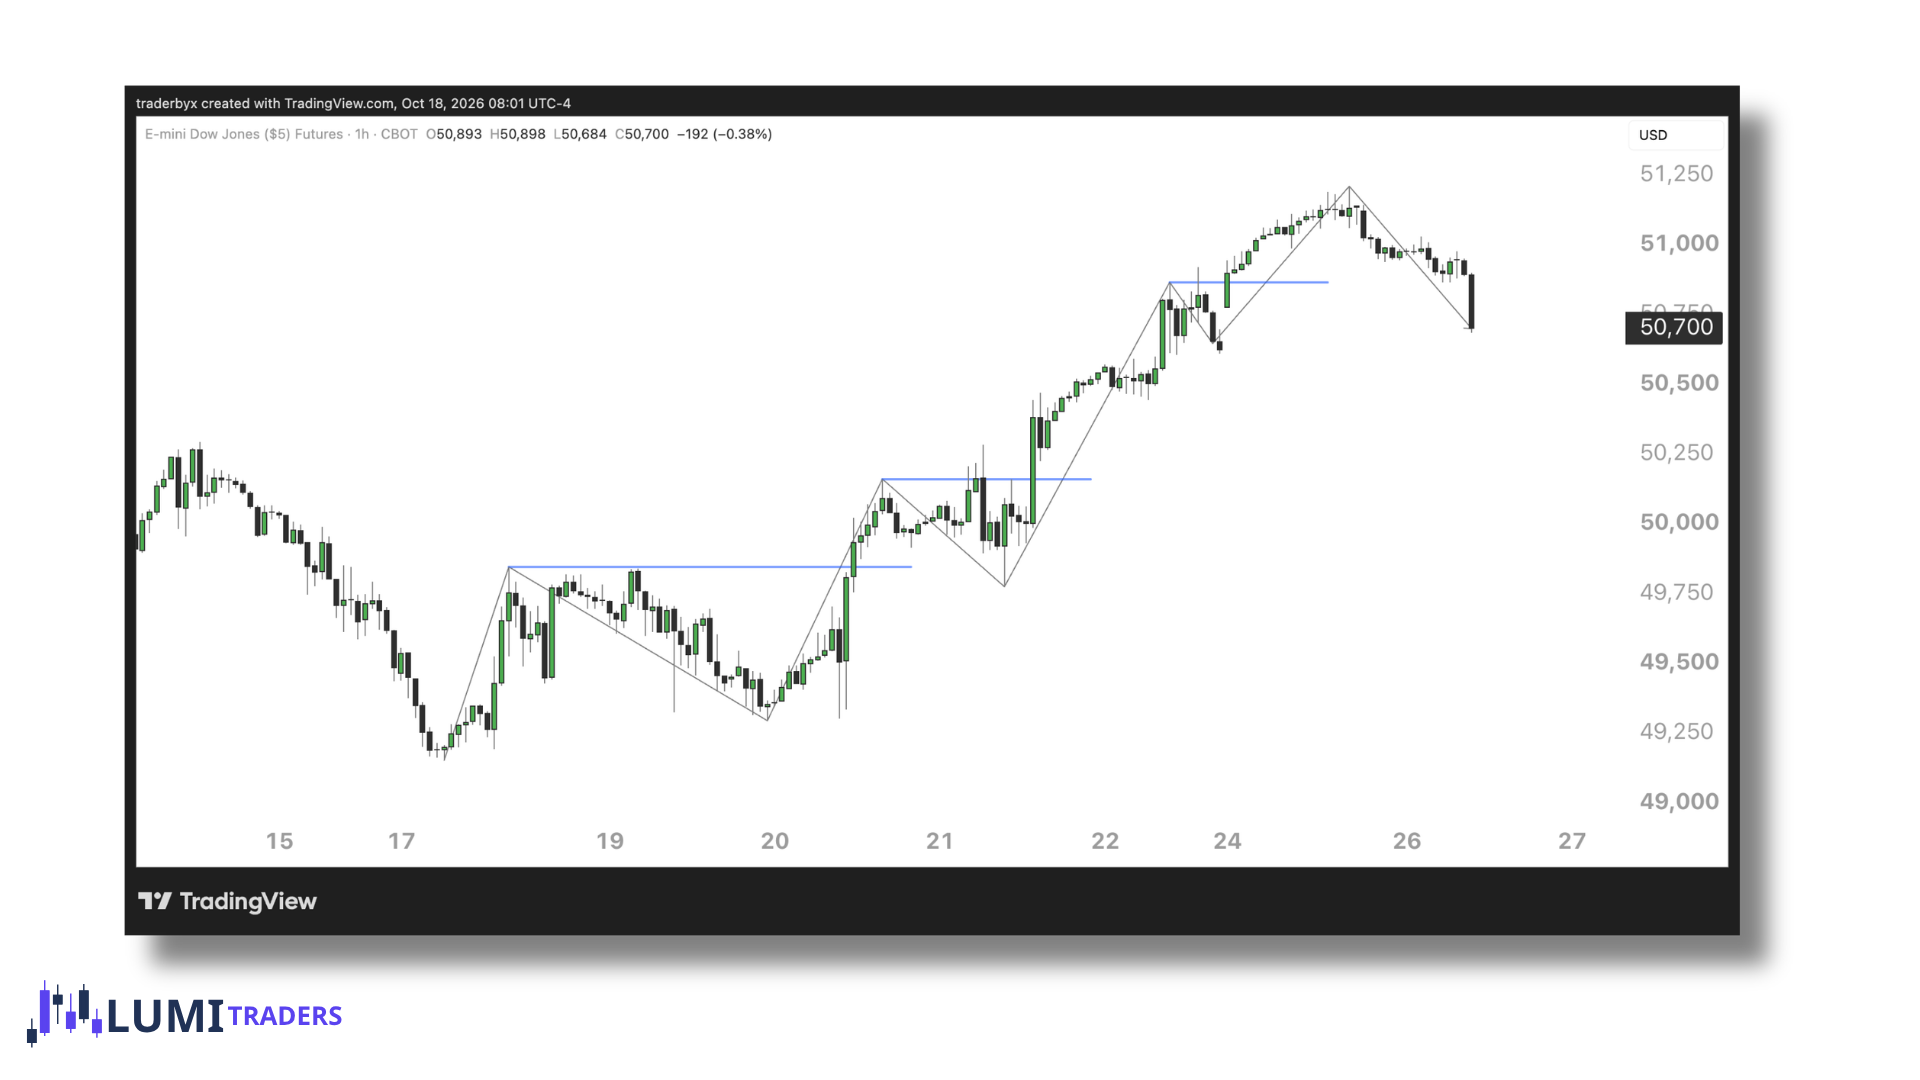
A bullish market generally produces:
Higher High → Higher Low → Higher High → Higher Low
In simple form:
HH → HL → HH → HL → HH
Price is progressing upward.
Every time price pulls back, buyers are able to protect a higher level.
Then price continues and creates another high.
A healthy bullish trend therefore needs two things:
Important lows continue holding.
Price continues breaking highs.
A bearish market generally produces:
Lower Low → Lower High → Lower Low → Lower High
Or:
LL → LH → LL → LH → LL
Price is progressing lower.
Every retracement fails below the previous important high.
Then sellers continue taking lows.
A healthy bearish trend needs:
Important highs to remain protected.
Price to continue breaking lows.
What Is a Swing High and Swing Low?
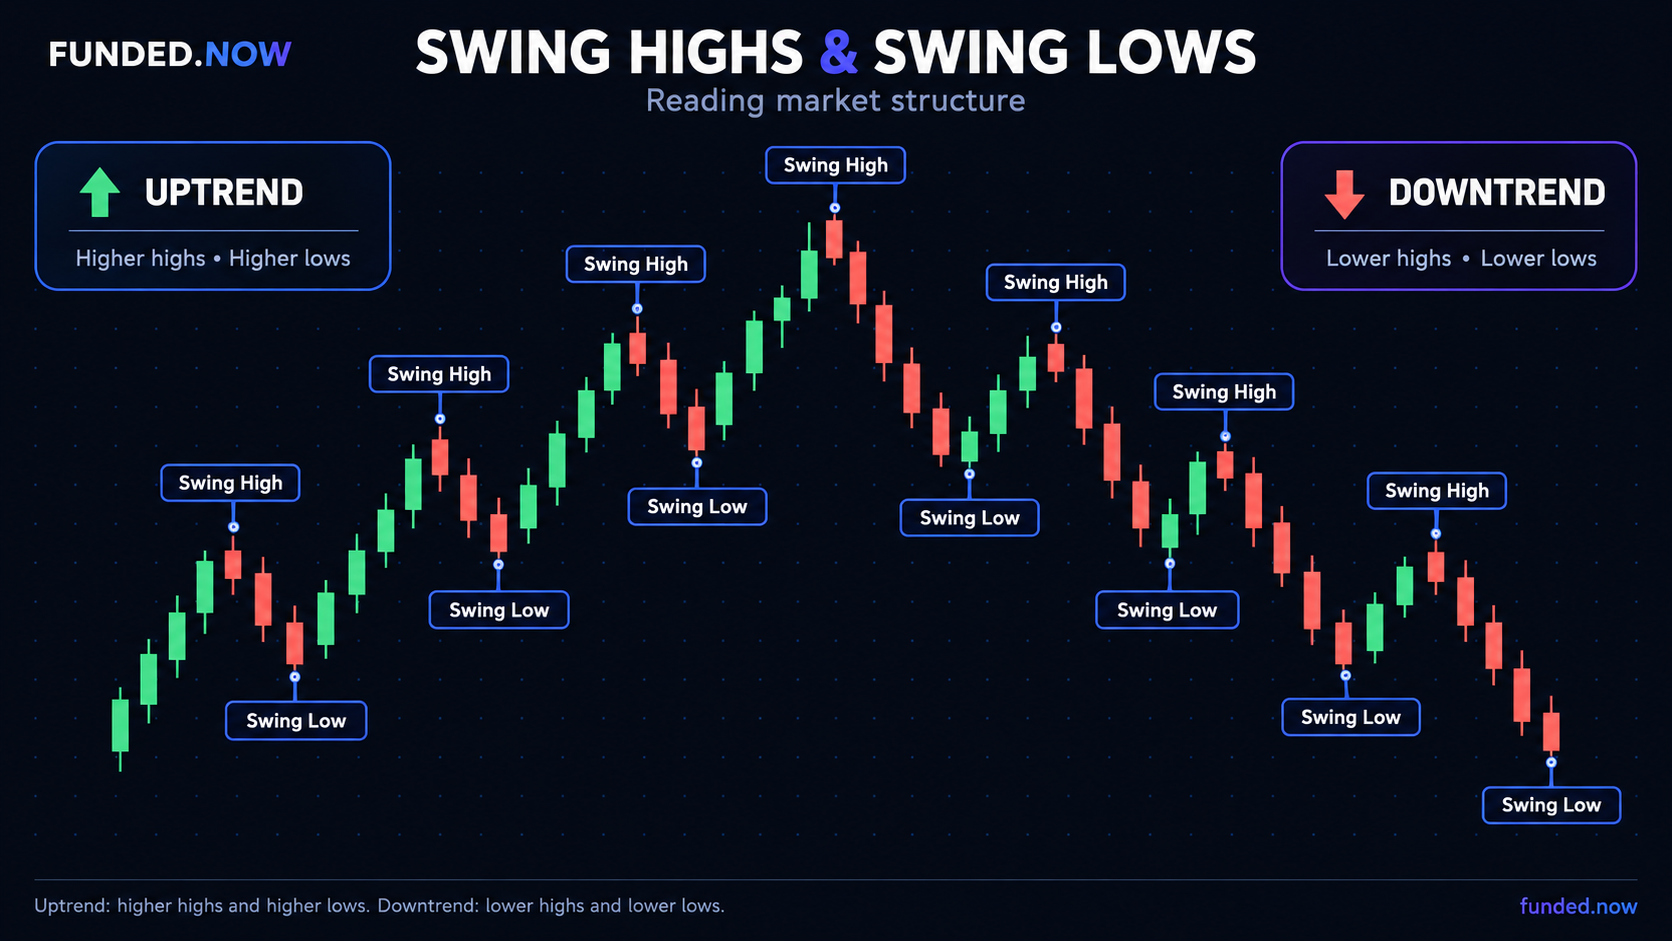
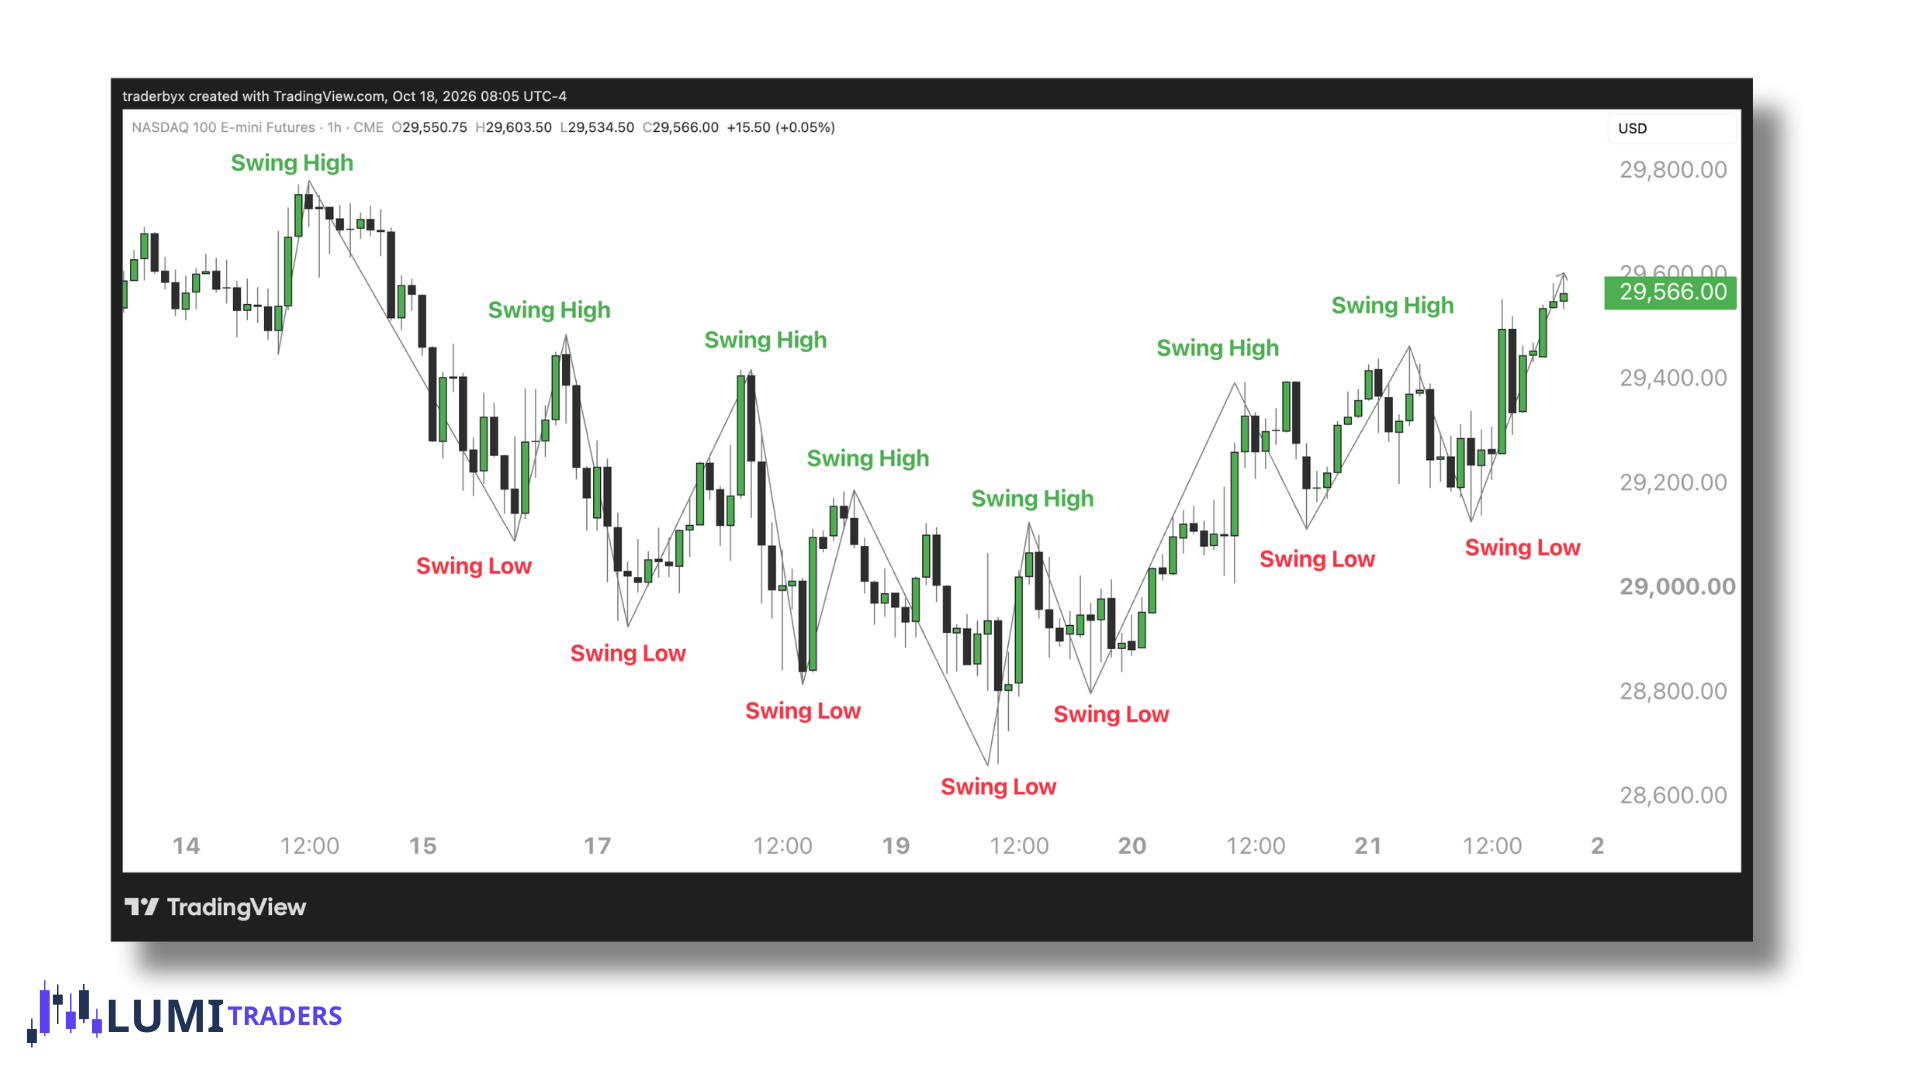
A swing point is a structural turning point in the market.
A swing high is a point where price moved higher and then turned lower.
It visually looks like a peak.
But not every tiny peak matters.
We want to identify meaningful highs that are part of the current structural sequence.
A swing high may later contain:
Buy-Side Liquidity — BSL
because stop losses and breakout orders may sit above that high.
A swing low is a point where price moved lower and then turned higher.
It looks like a valley.
A meaningful swing low can contain:
Sell-Side Liquidity — SSL
below it.
This becomes important because market structure and liquidity work together.
Price may:
Break a swing
Sweep a swing
Fail at a swing
Use that swing as the basis for a protected point
The Difference Between Liquidity and Structure
This is one of the most important beginner concepts.
A price level can be taken in two very different ways.
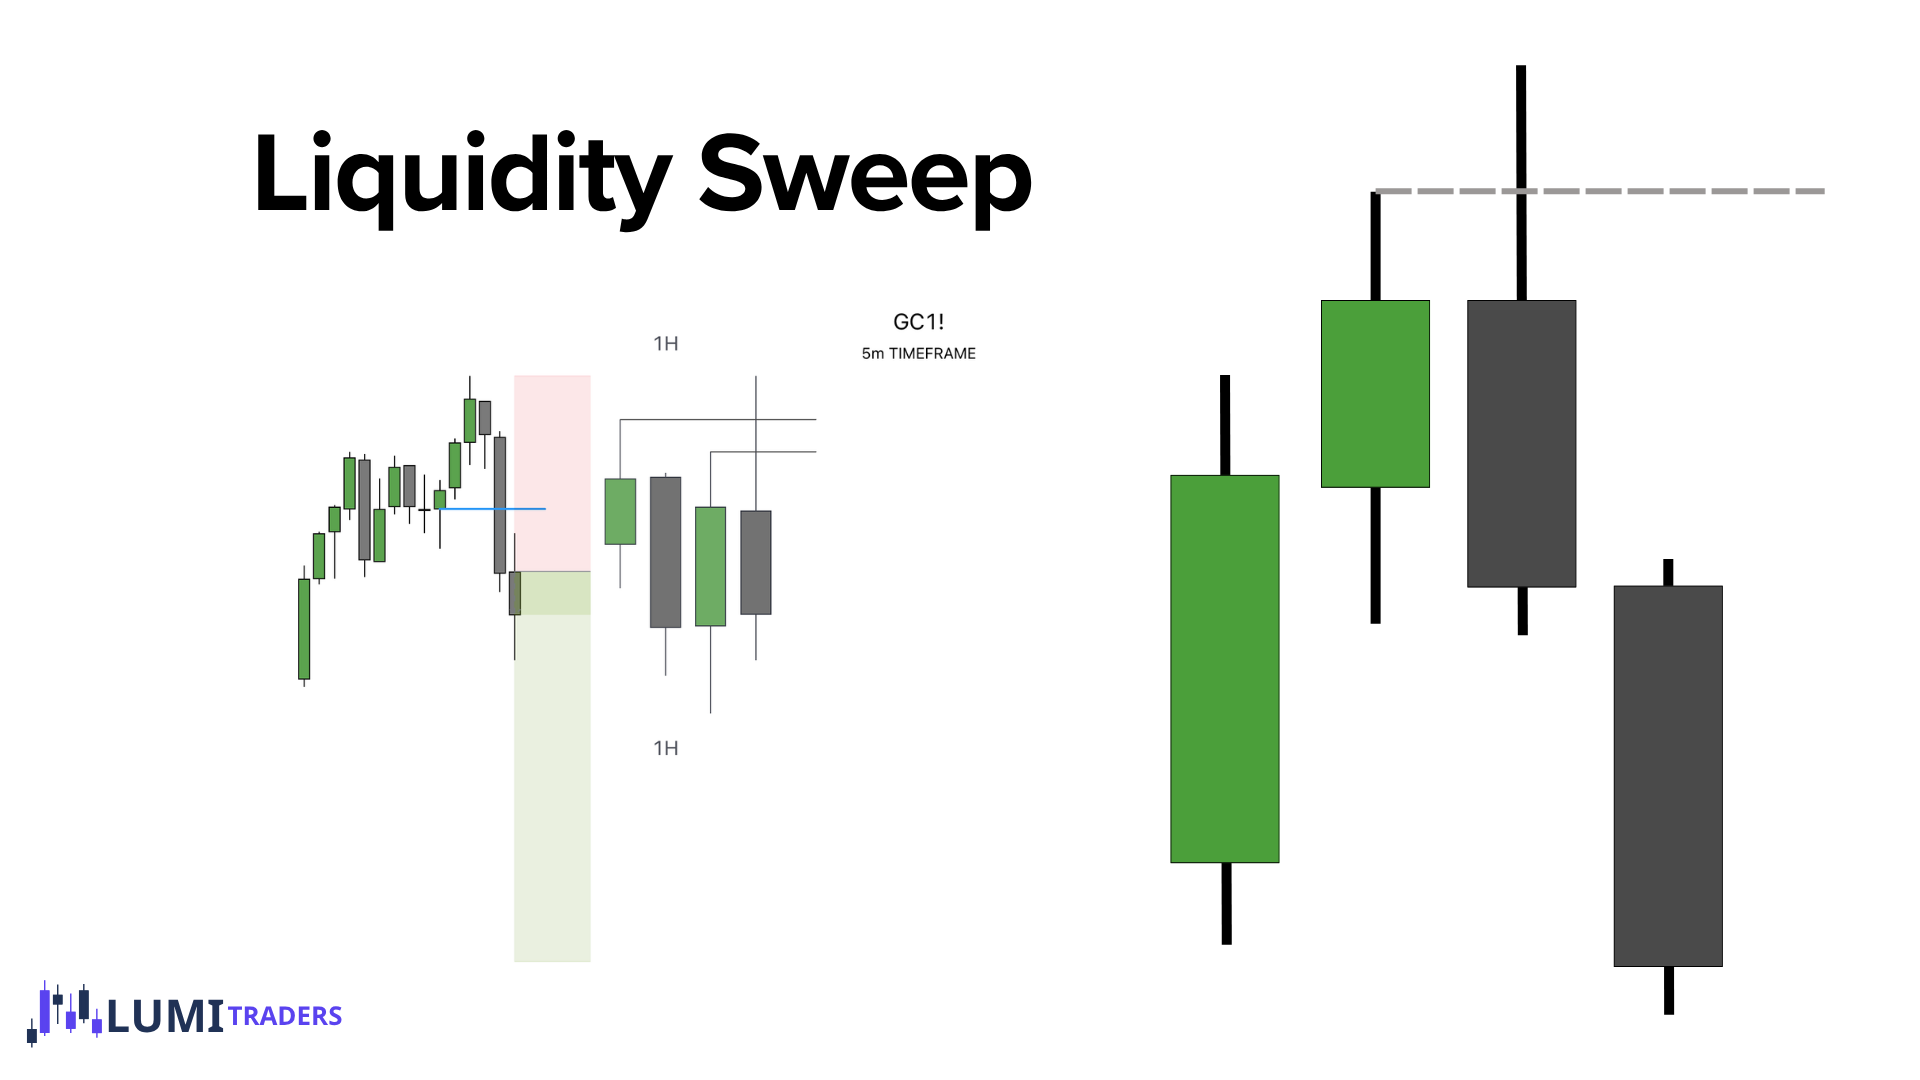
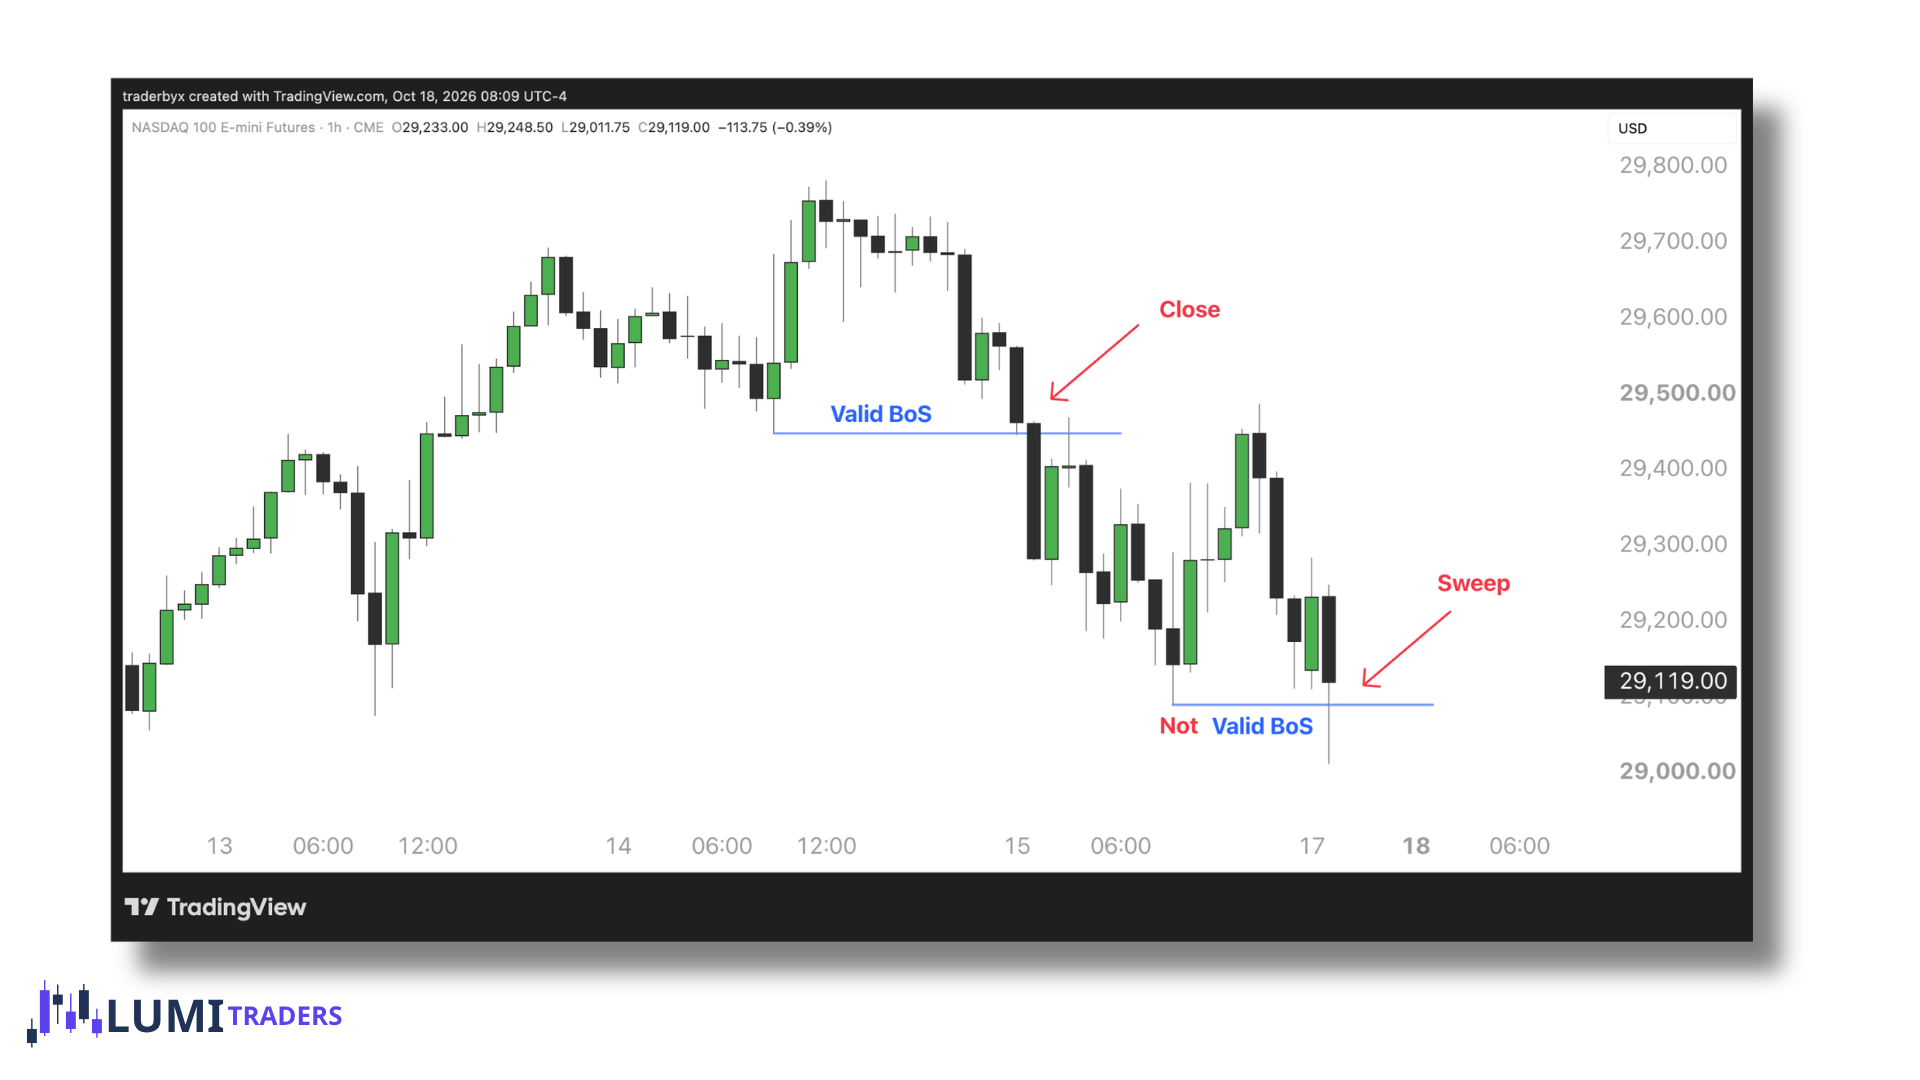
Liquidity Sweep
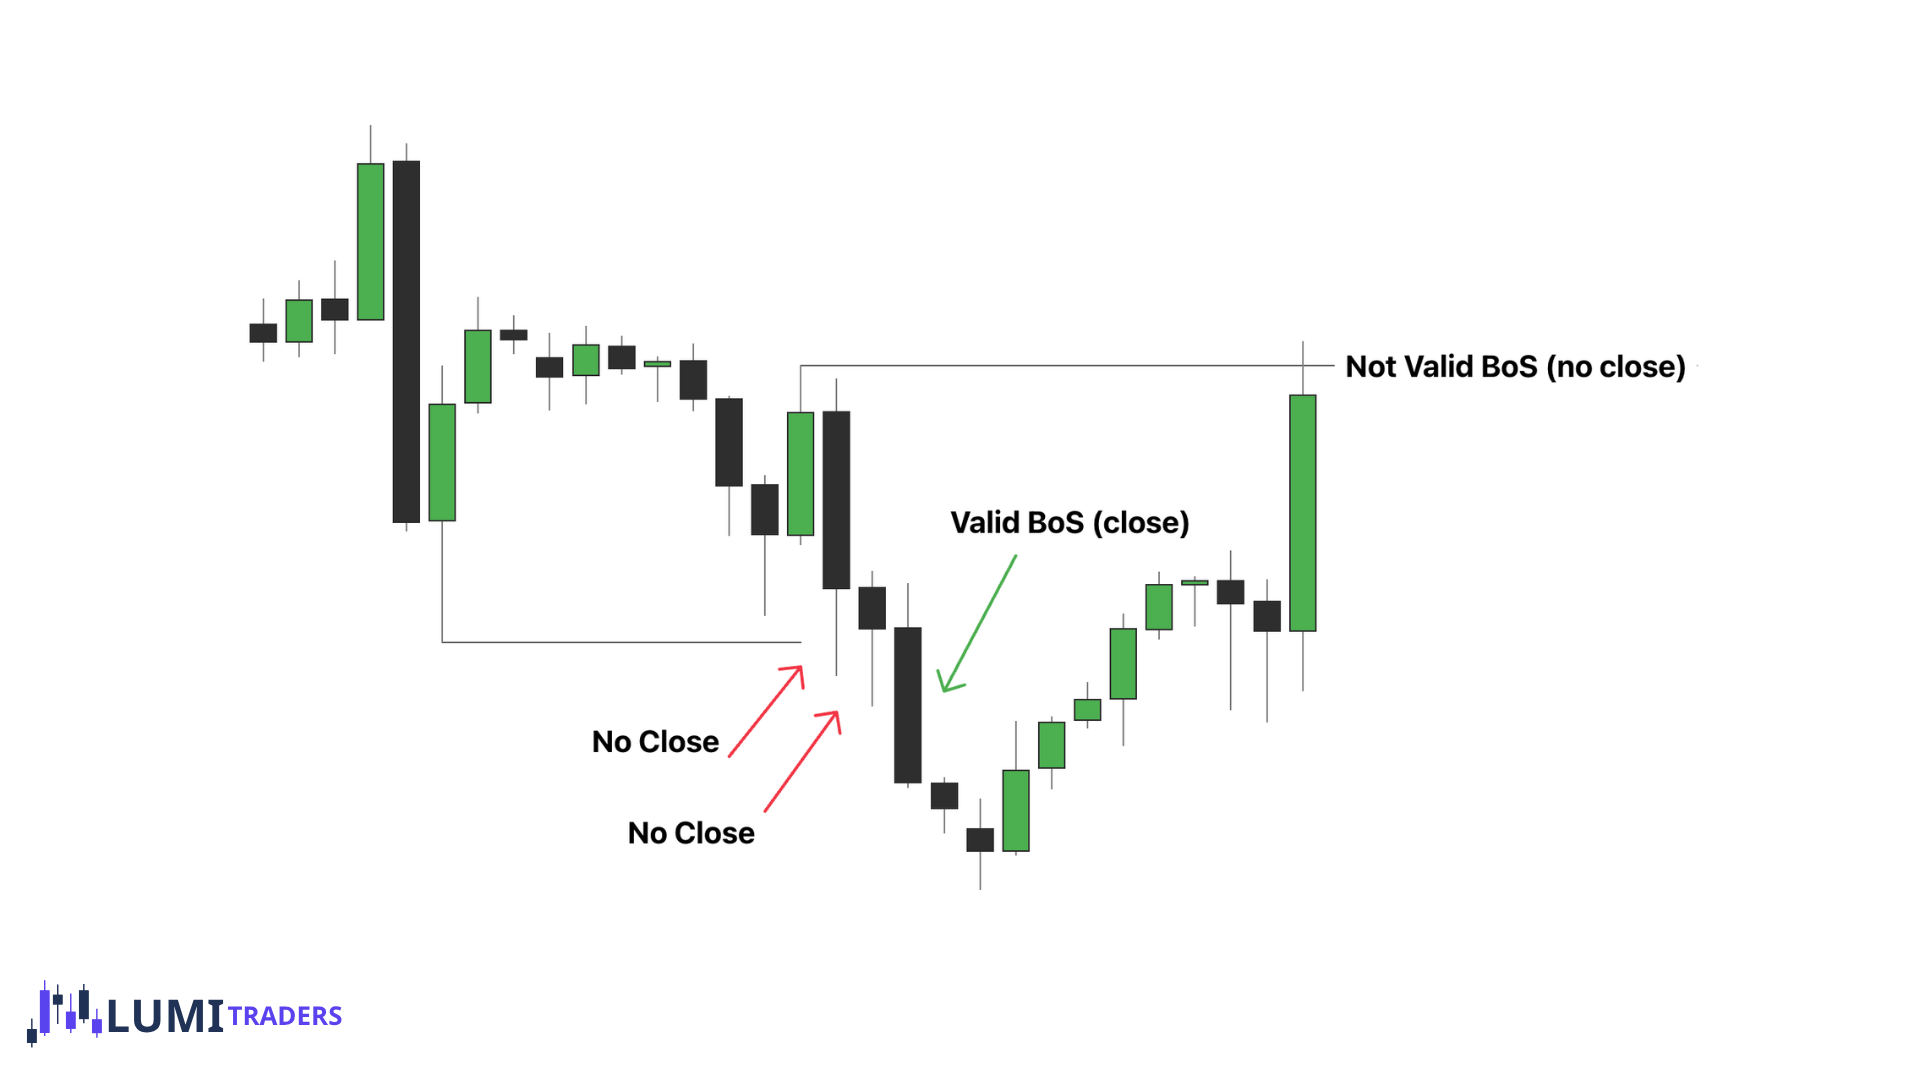
Price trades through the level with a wick but does not close beyond it.
Structural Break
Price trades through the level and closes beyond it.
So remember:
Wick = liquidity information.
Close = structure information.
This rule will prevent a lot of incorrect structure mapping.
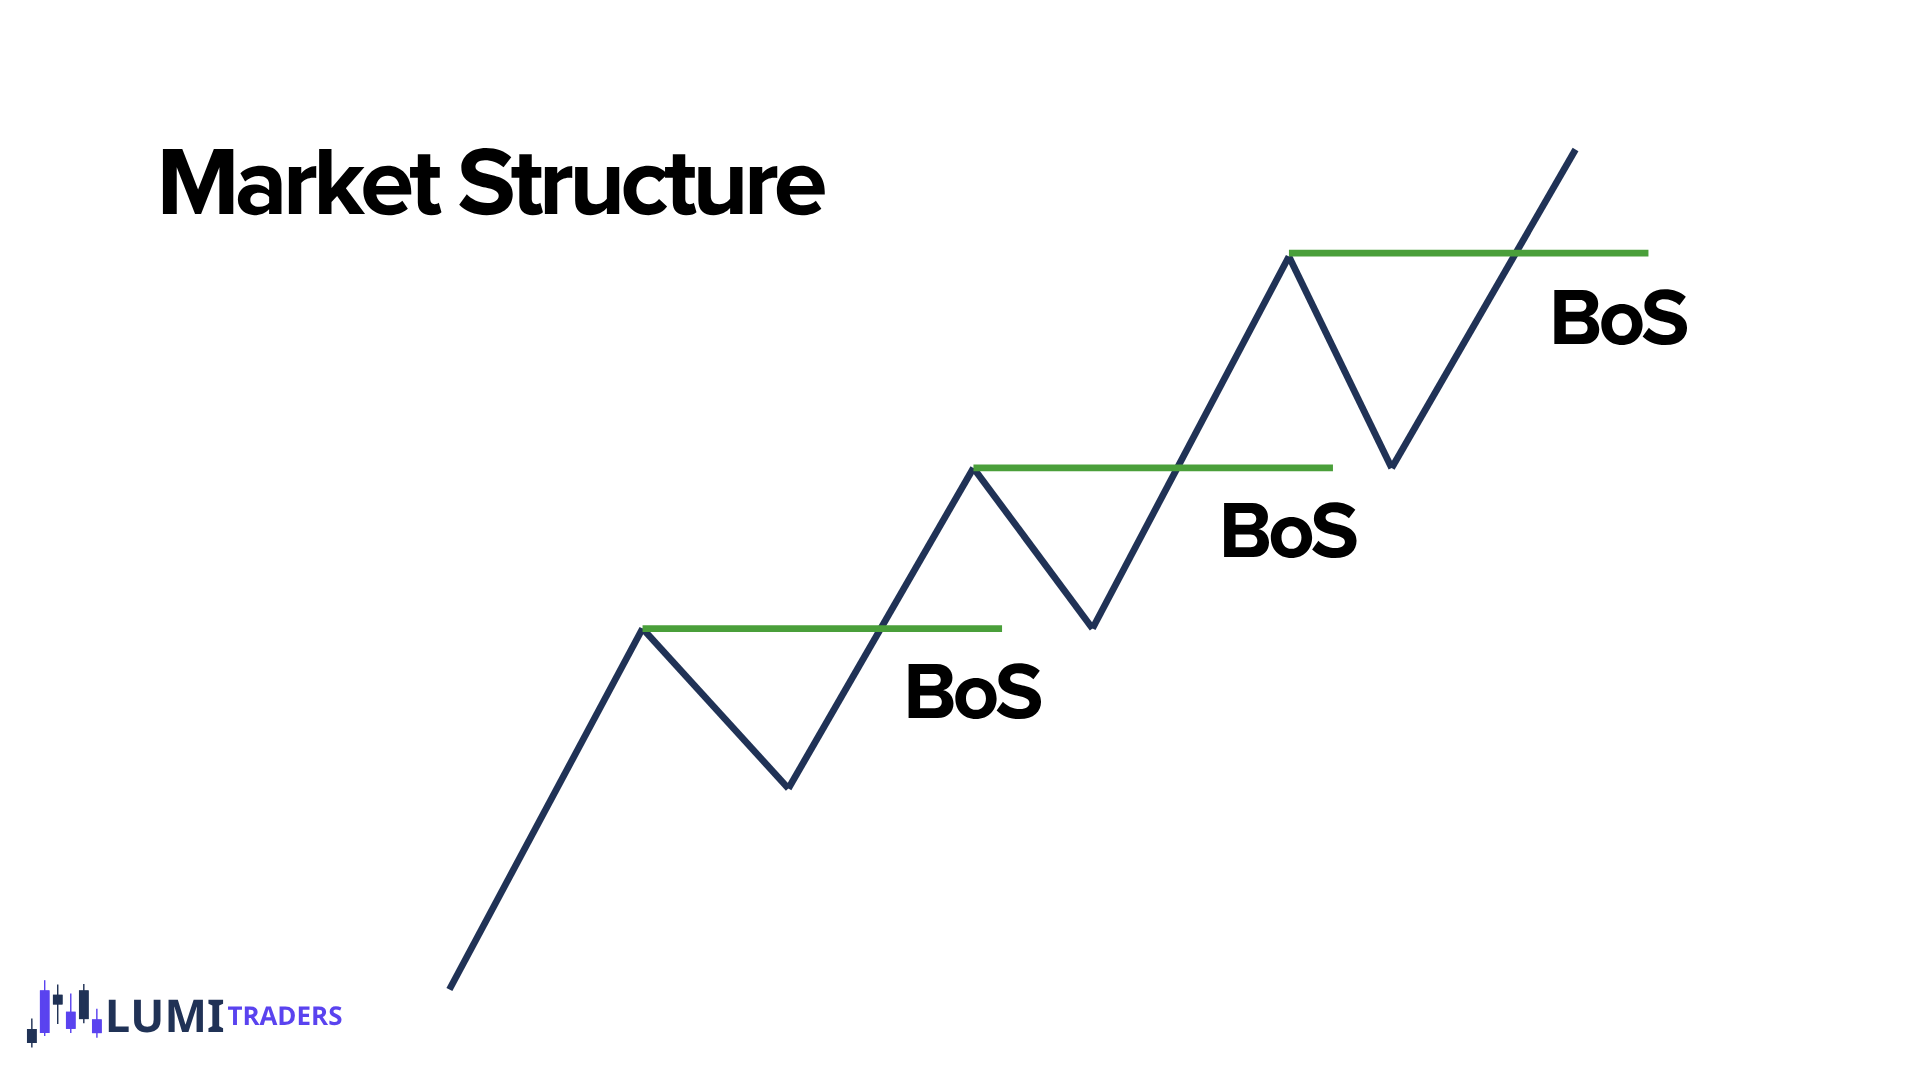
What Is Break of Structure — BOS?
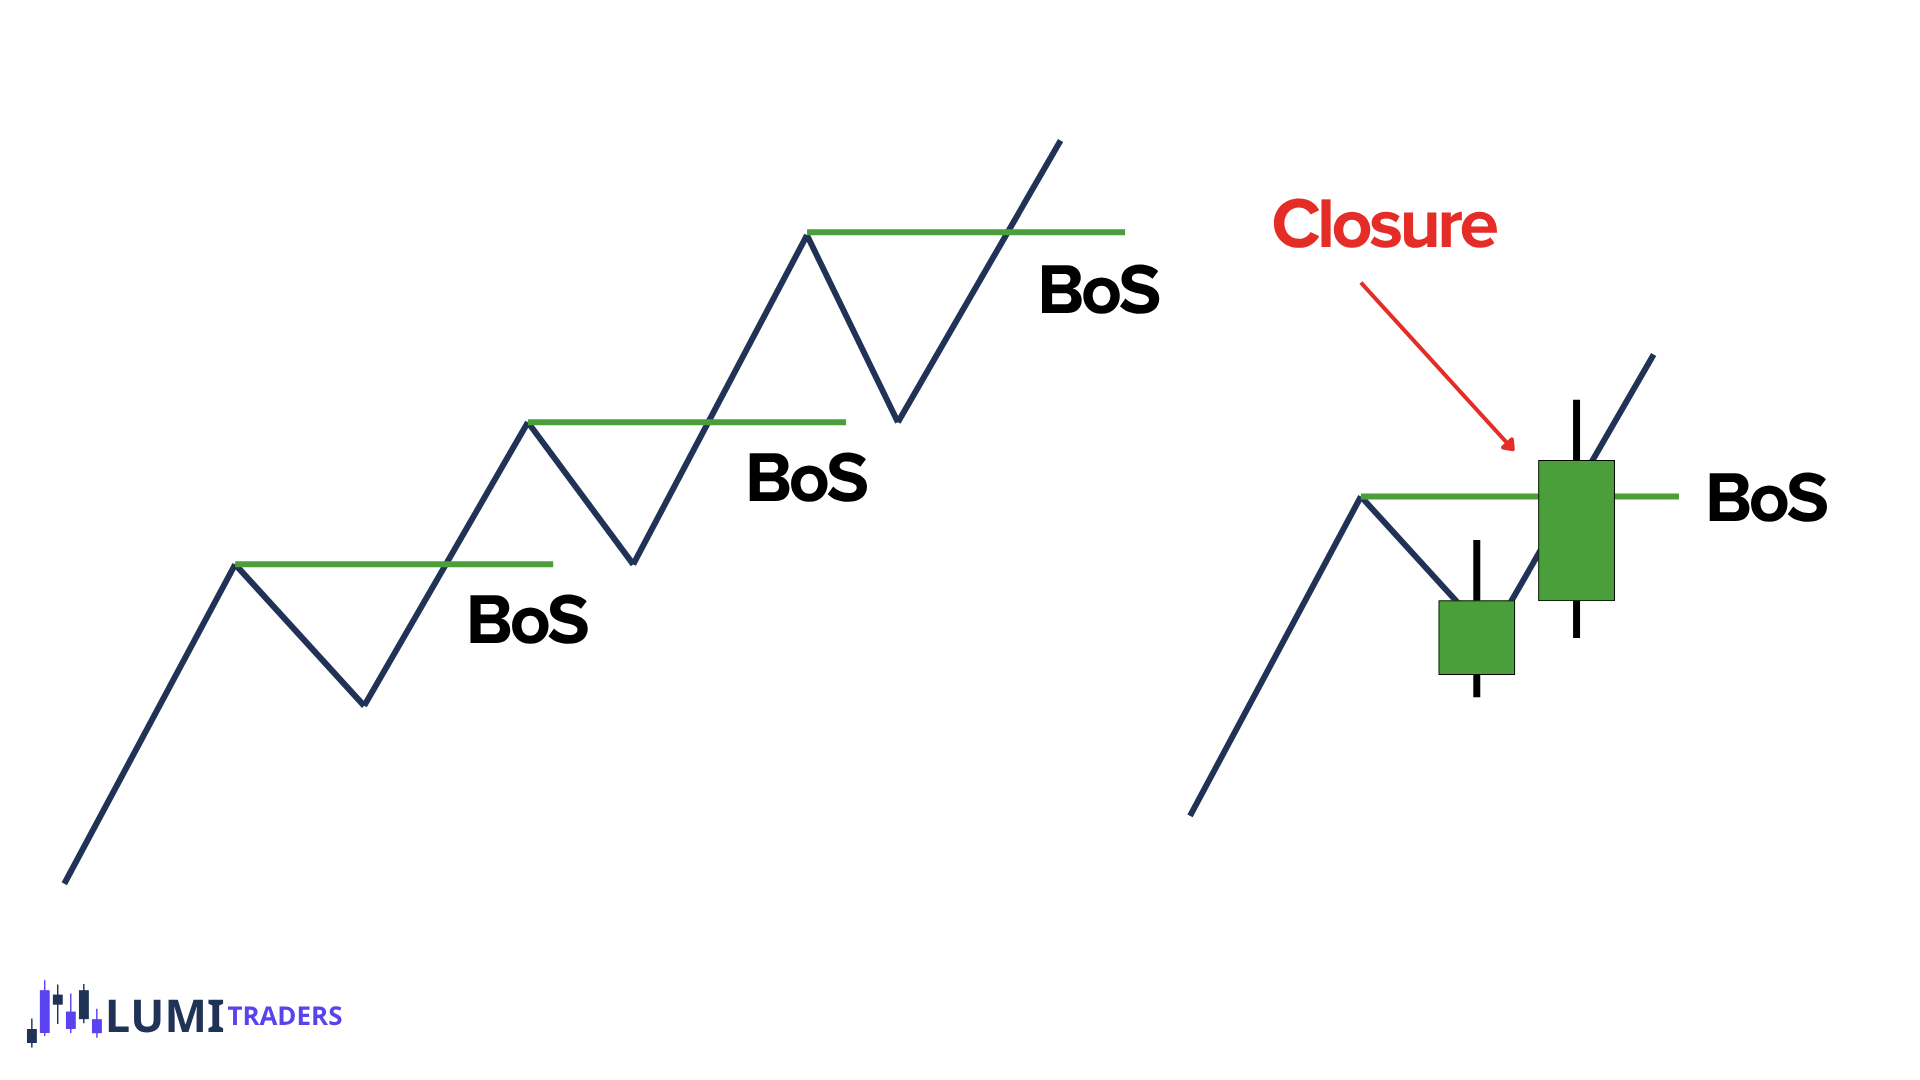
A Break of Structure, or BOS, occurs when price confirms continuation through a previous meaningful swing.
For bullish structure:
Price must close above the previous swing high.
For bearish structure:
Price must close below the previous swing low.
The word close matters.
A wick is not enough.
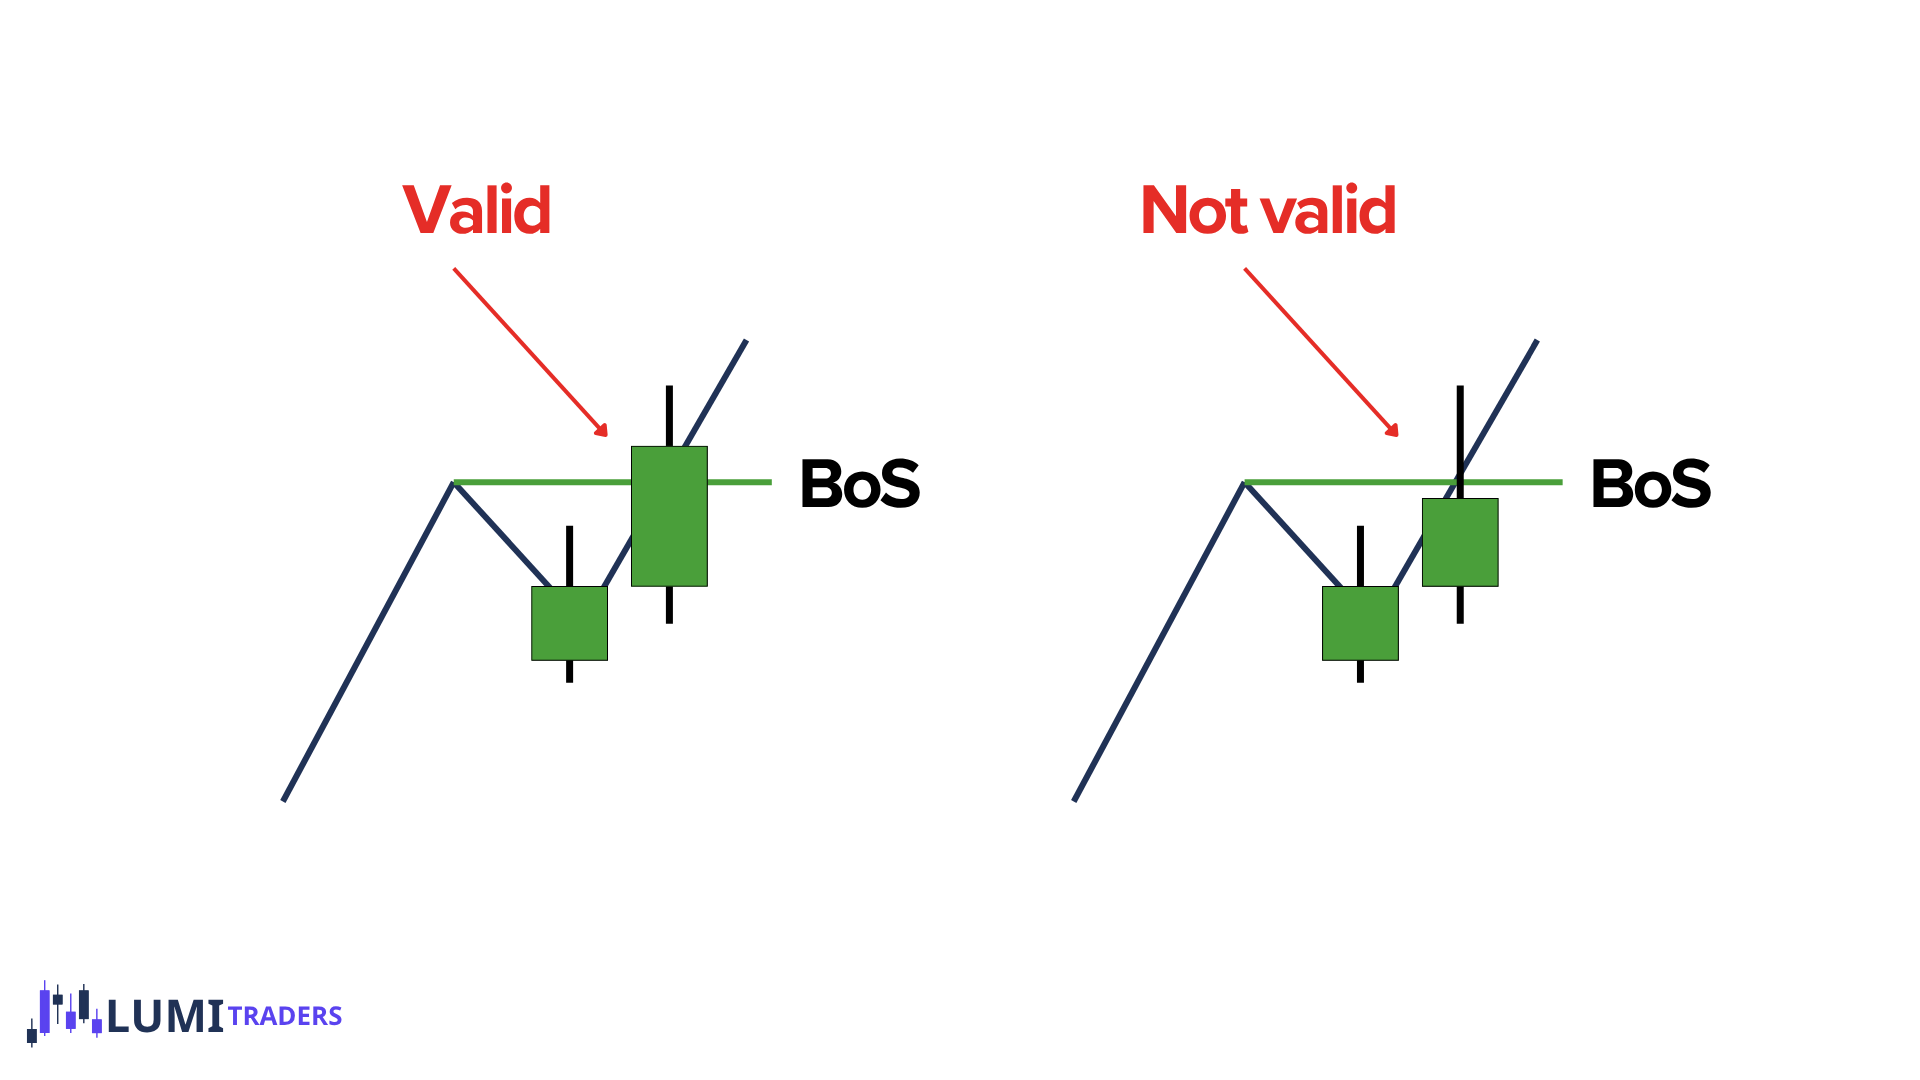
Valid BOS
Imagine price is bullish.
There is a previous swing high. Price rallies toward that high.
Possibility 1
Price trades one tick above the high.
Then closes back below.
That is:
Buy-Side Liquidity Sweep
It is not BOS.
Possibility 2
Price rallies through the high and the candle body closes above it.
Now we have:
Valid Bullish BOS
This tells us bullish structure successfully continued.
The Core BOS Rule
The easiest rule in the entire lesson:
Bullish BOS
Close above the previous swing high.
Bearish BOS
Close below the previous swing low.
Wick only
Sweep — not BOS.
Do not make structure more complicated than this.
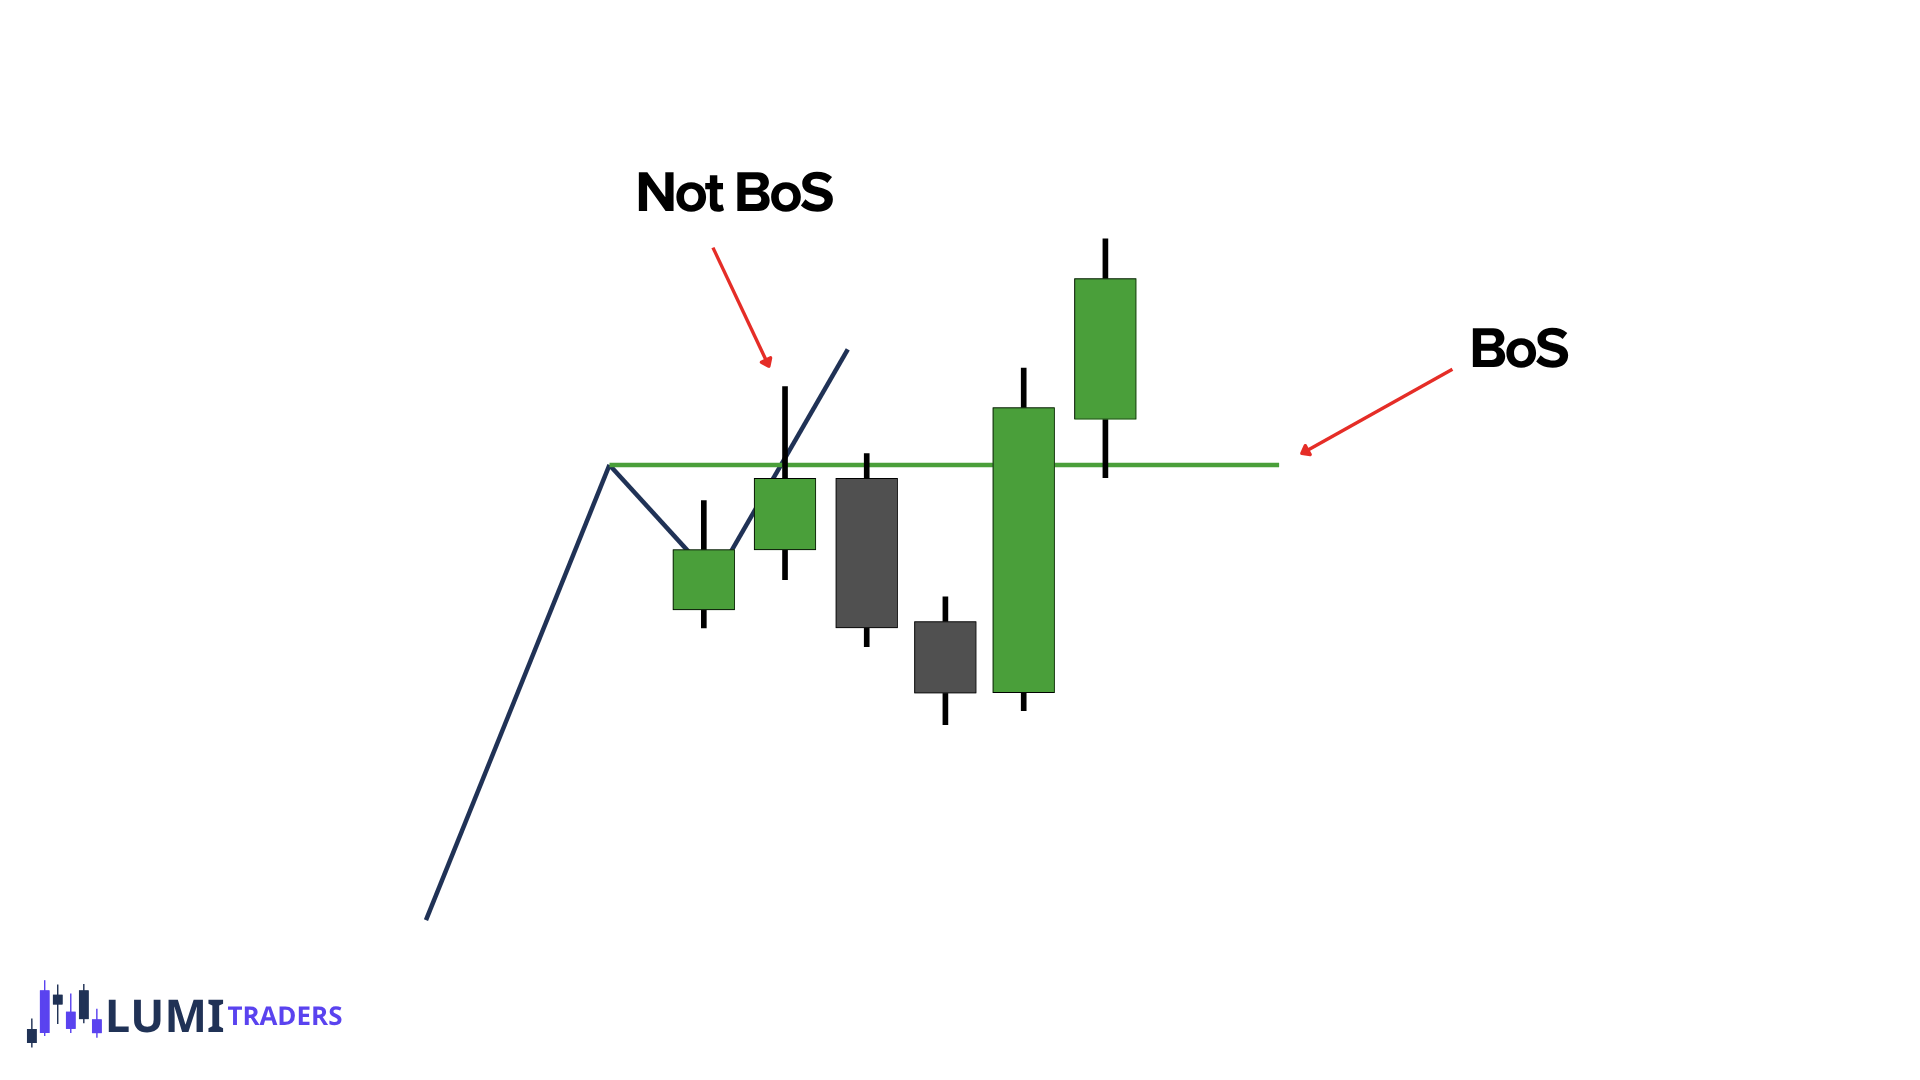
What Happens If a Swing Is Swept but BOS Is Not Confirmed?
This is extremely important.
Suppose the previous swing high is at a certain level.
Price wicks above it.
But there is no candle-body closure above it.
Do not remove that swing.
Do not create a new BOS level.
Do not automatically say a new HH has been structurally confirmed.
That original high remains the swing we are watching.
If price comes back later and finally closes above it:
then we have valid BOS.
So:
A swing can be swept first and broken structurally later.
What Is a Protected Swing?
Once we understand BOS, we can understand protected highs and lows.
A protected swing is a high or low that the current trend should not violate if structure is going to remain valid.
But there is a very important rule:
A swing does not become protected just because it looks like a swing.
It becomes protected because it produced a valid BOS.
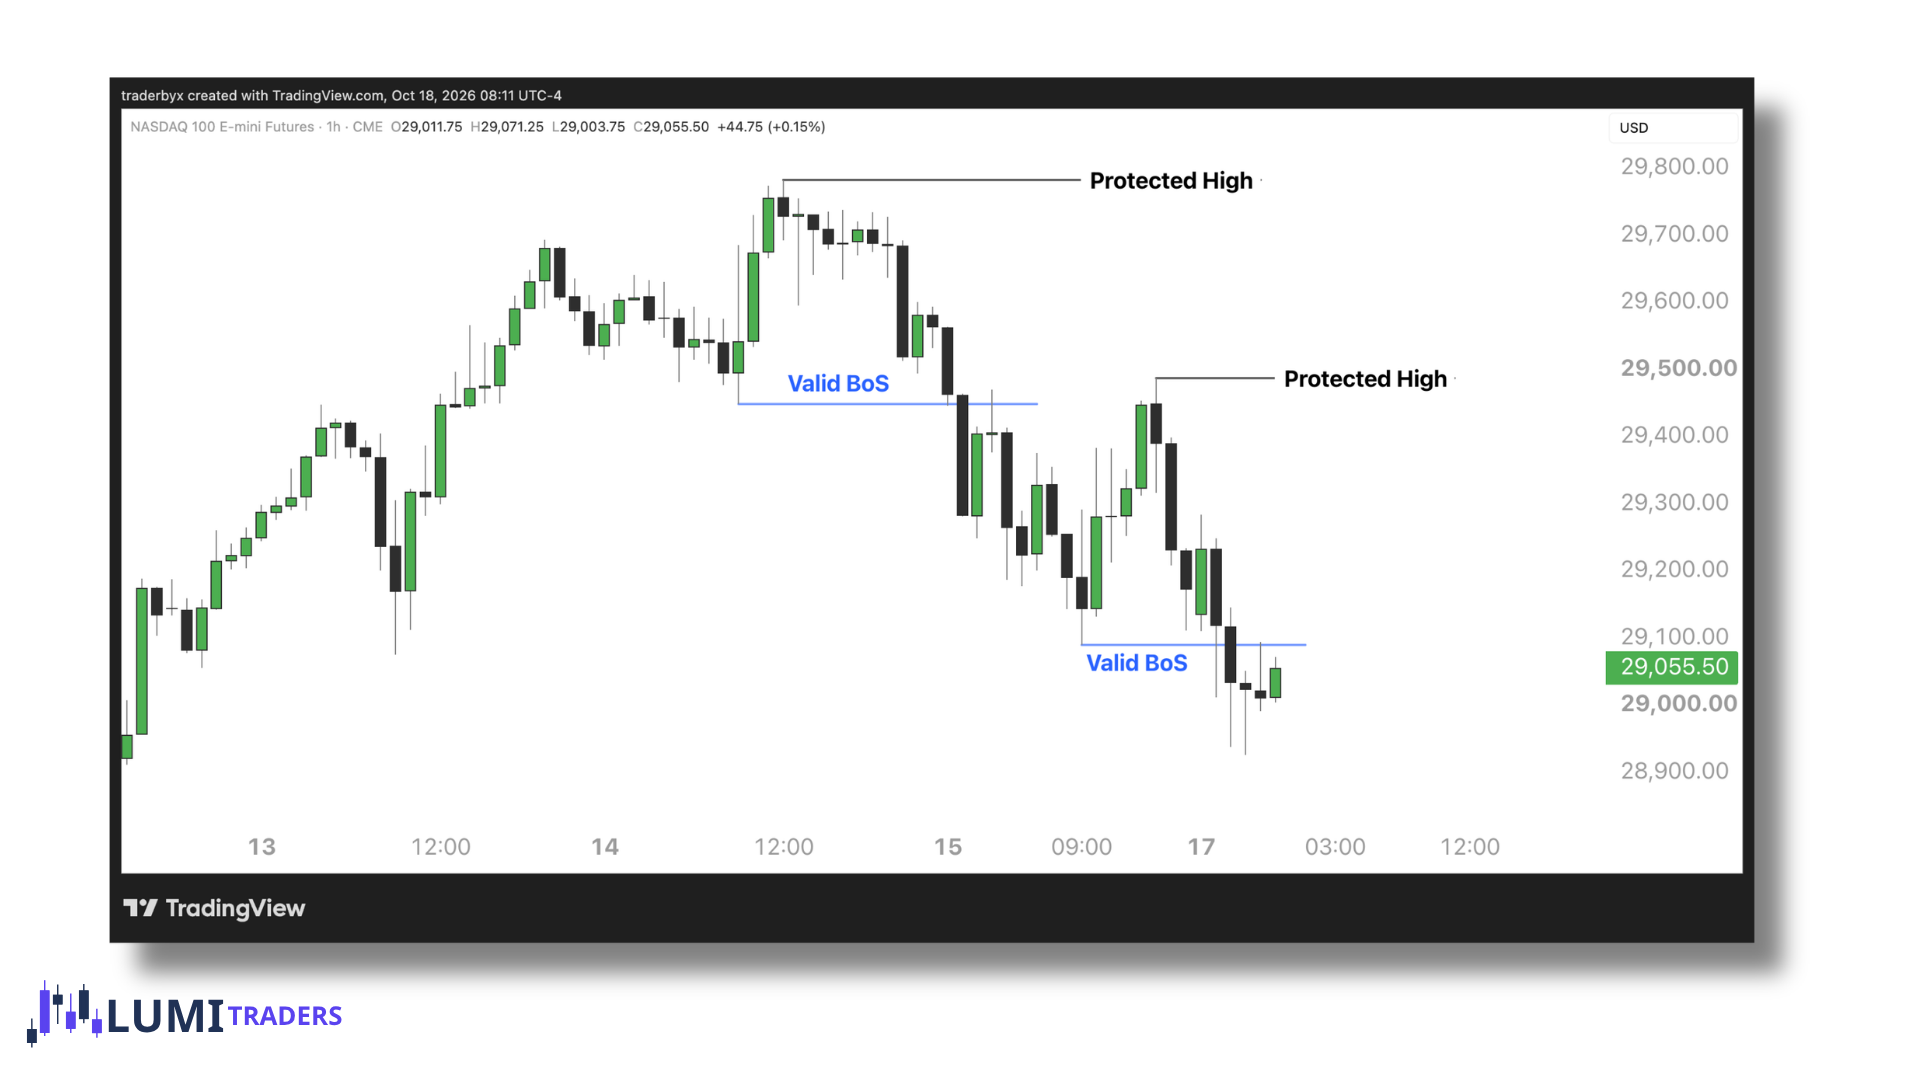
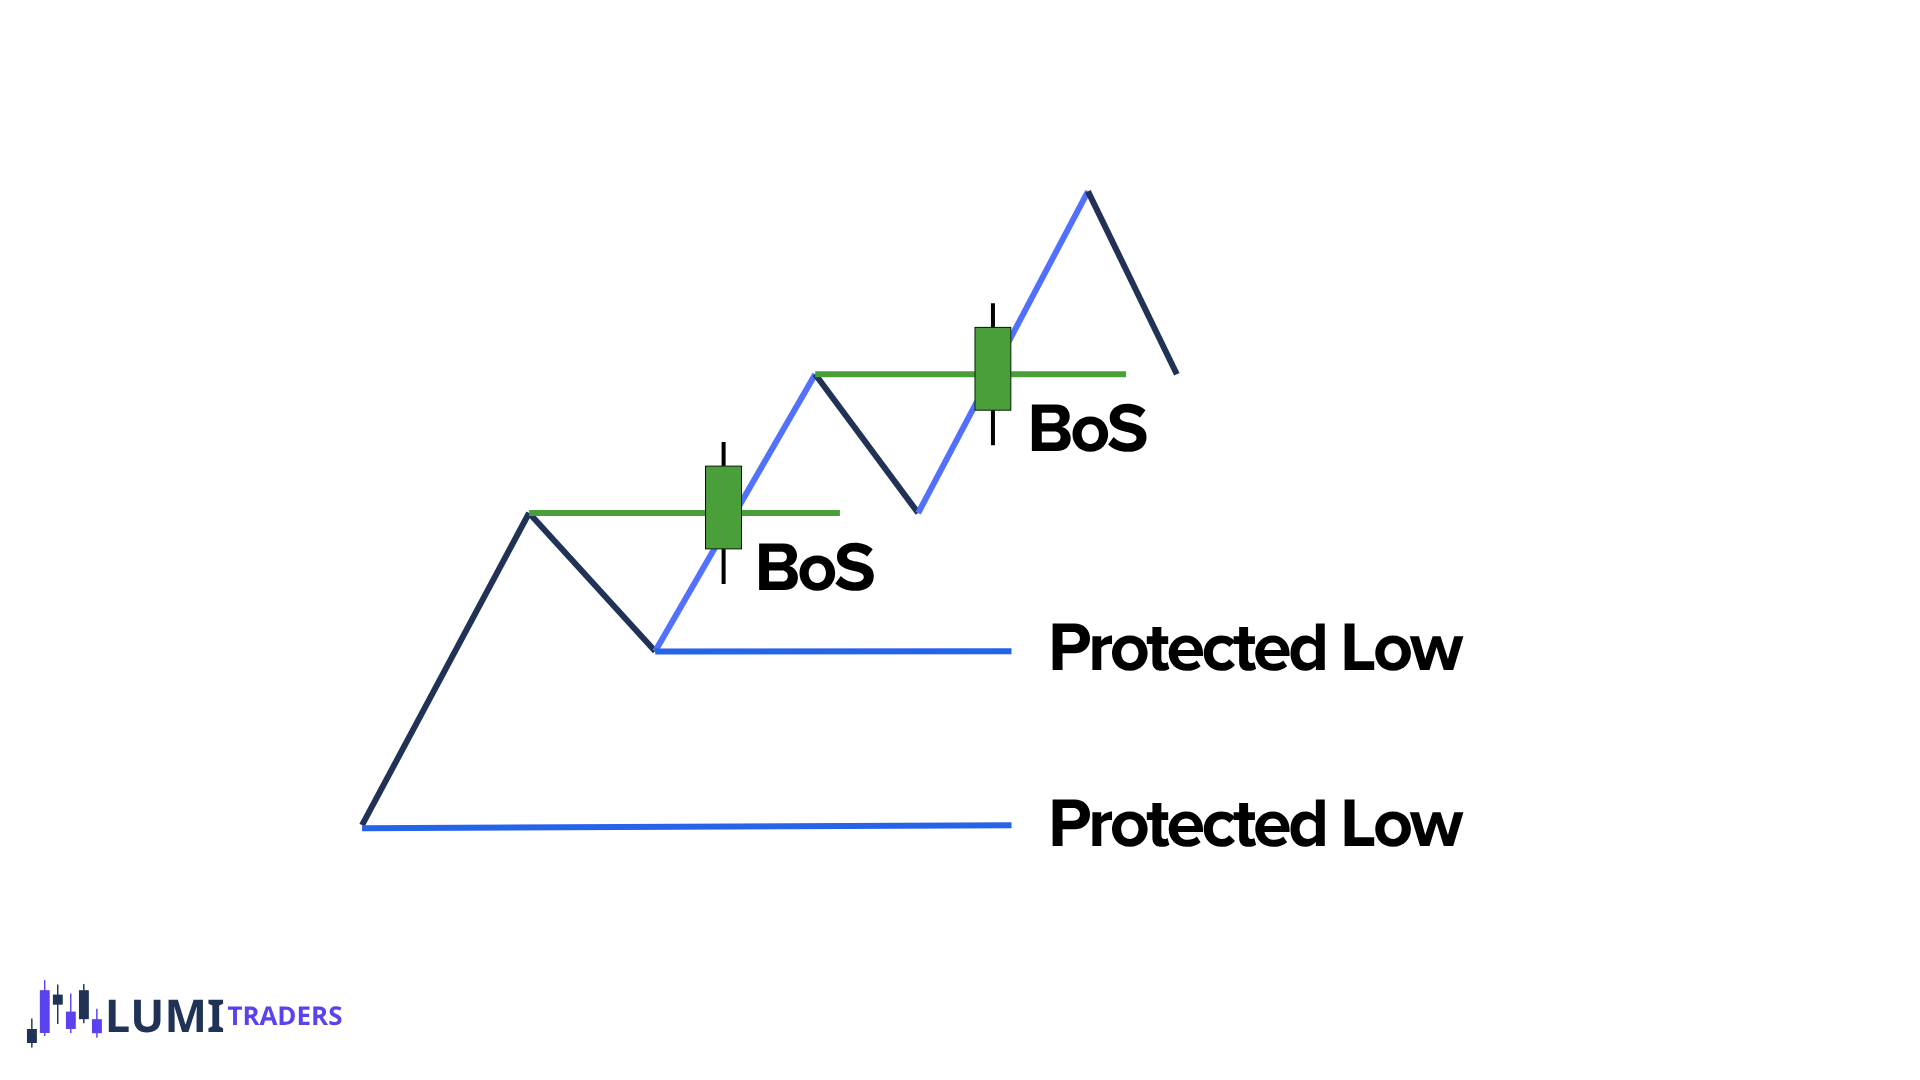
A Protected Low belongs to bullish structure.
(Same idea applies for Protected High)
Suppose price forms a low.
From that low, price rallies and closes above the previous meaningful high.
Now we have:
Valid Bullish BOS
The low responsible for producing that BOS can now become:
Protected Low
The sequence is:
Low → rally → close above High → BOS → Low becomes Protected
Why Is the Low Protected?
Because if the market is genuinely bullish, the low that produced the structural breakout should hold.
Price may retrace.
It may trade deeply into the range.
But if price eventually destroys that protected low, bullish structure becomes questionable.
That protected low therefore becomes an important structural invalidation point.
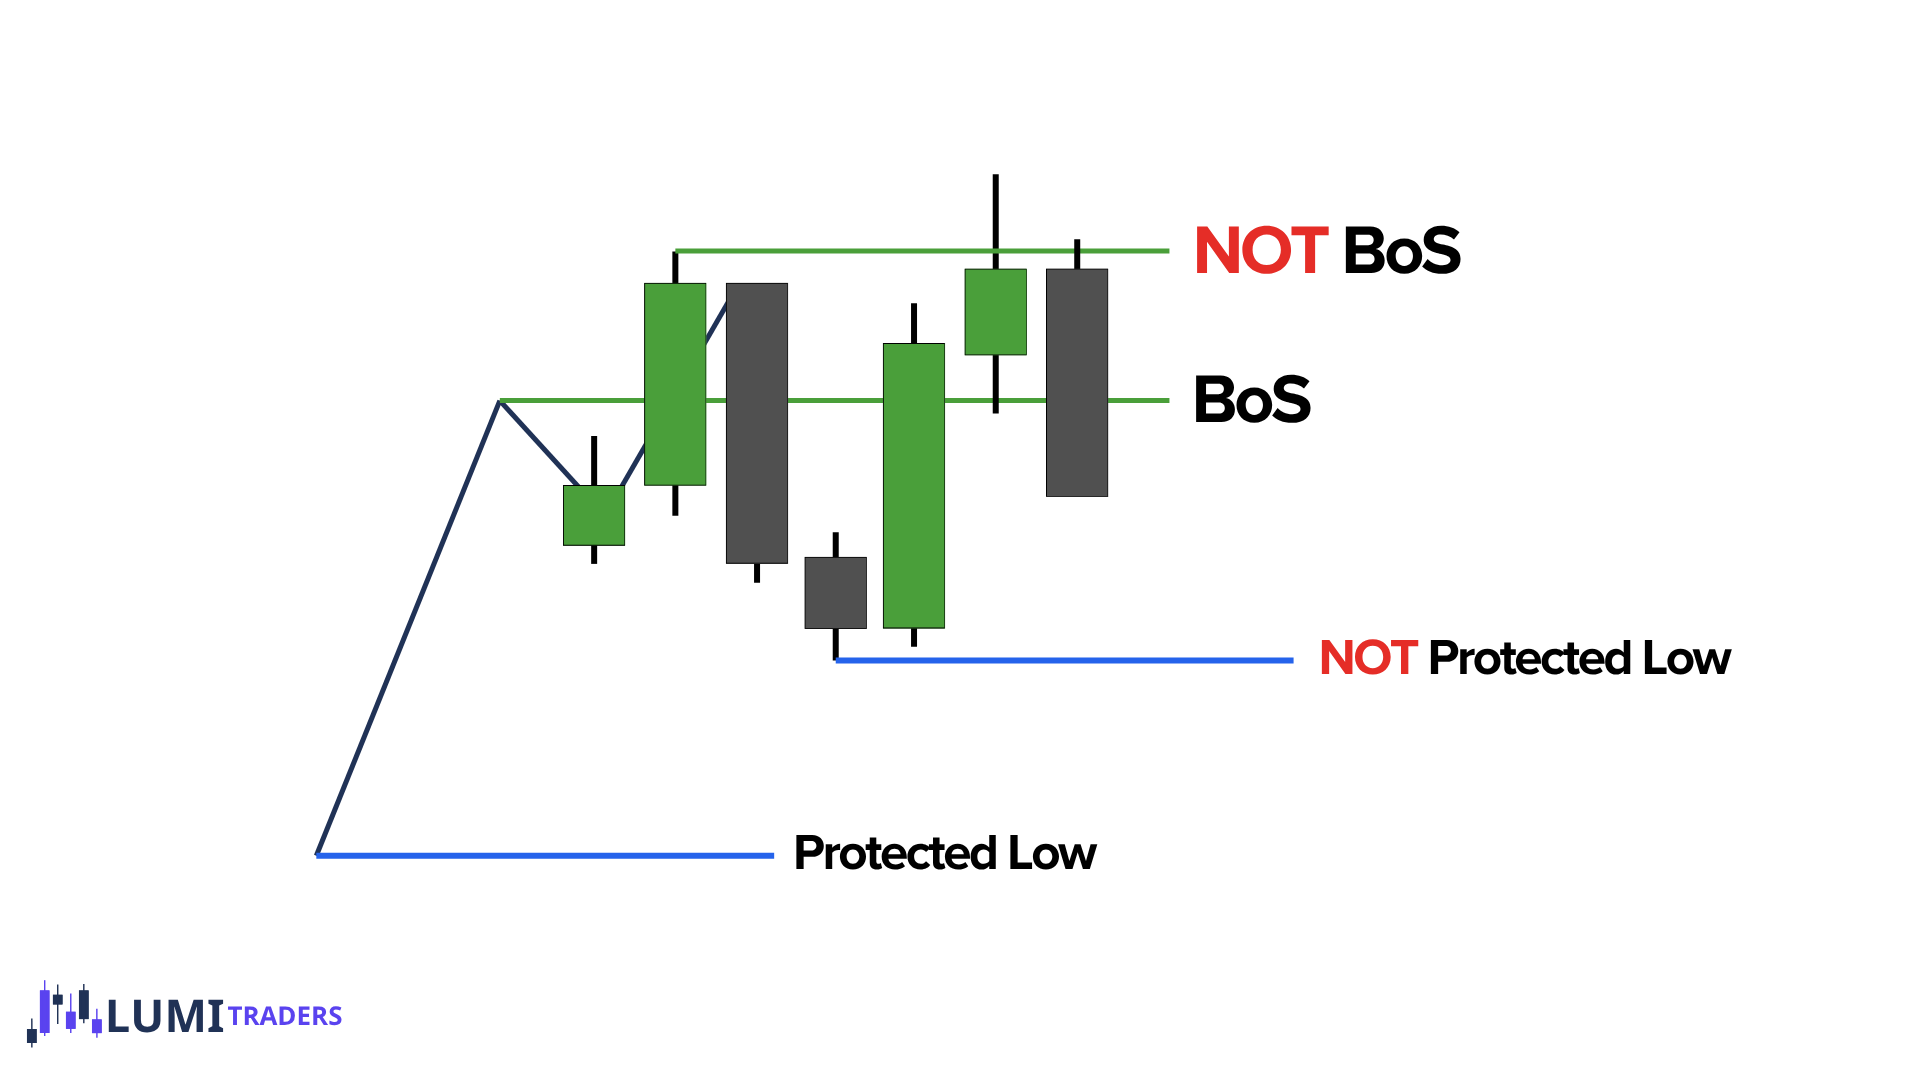
No BOS = No New Protected Swing
This is one of the strongest rules in the lesson.
Suppose price rallies from a low and only sweeps the previous high.
No close above.
Therefore:
No valid bullish BOS.
And because we do not have BOS:
That low does not become a new Protected Low.
The bearish version:
Price drops from a high.
Sweeps previous low.
No close below.
No BOS.
Therefore:
No new Protected High.
So:
Protected swings are earned through valid BOS.
Healthy Structure
Now we can put the pieces together.
A healthy bullish market looks like:
Protected Low
→ bullish expansion
→ Valid BOS
→ pullback
→ Higher Low
→ continuation
→ Valid BOS
→ new Protected Low
Then repeat.
The market is doing exactly what a bullish market should do:
taking highs and protecting lows.
A healthy bearish market looks like:
Protected High
→ bearish expansion
→ Valid BOS
→ retracement
→ Lower High
→ continuation
→ Valid BOS
→ new Protected High
The market is:
taking lows and protecting highs.
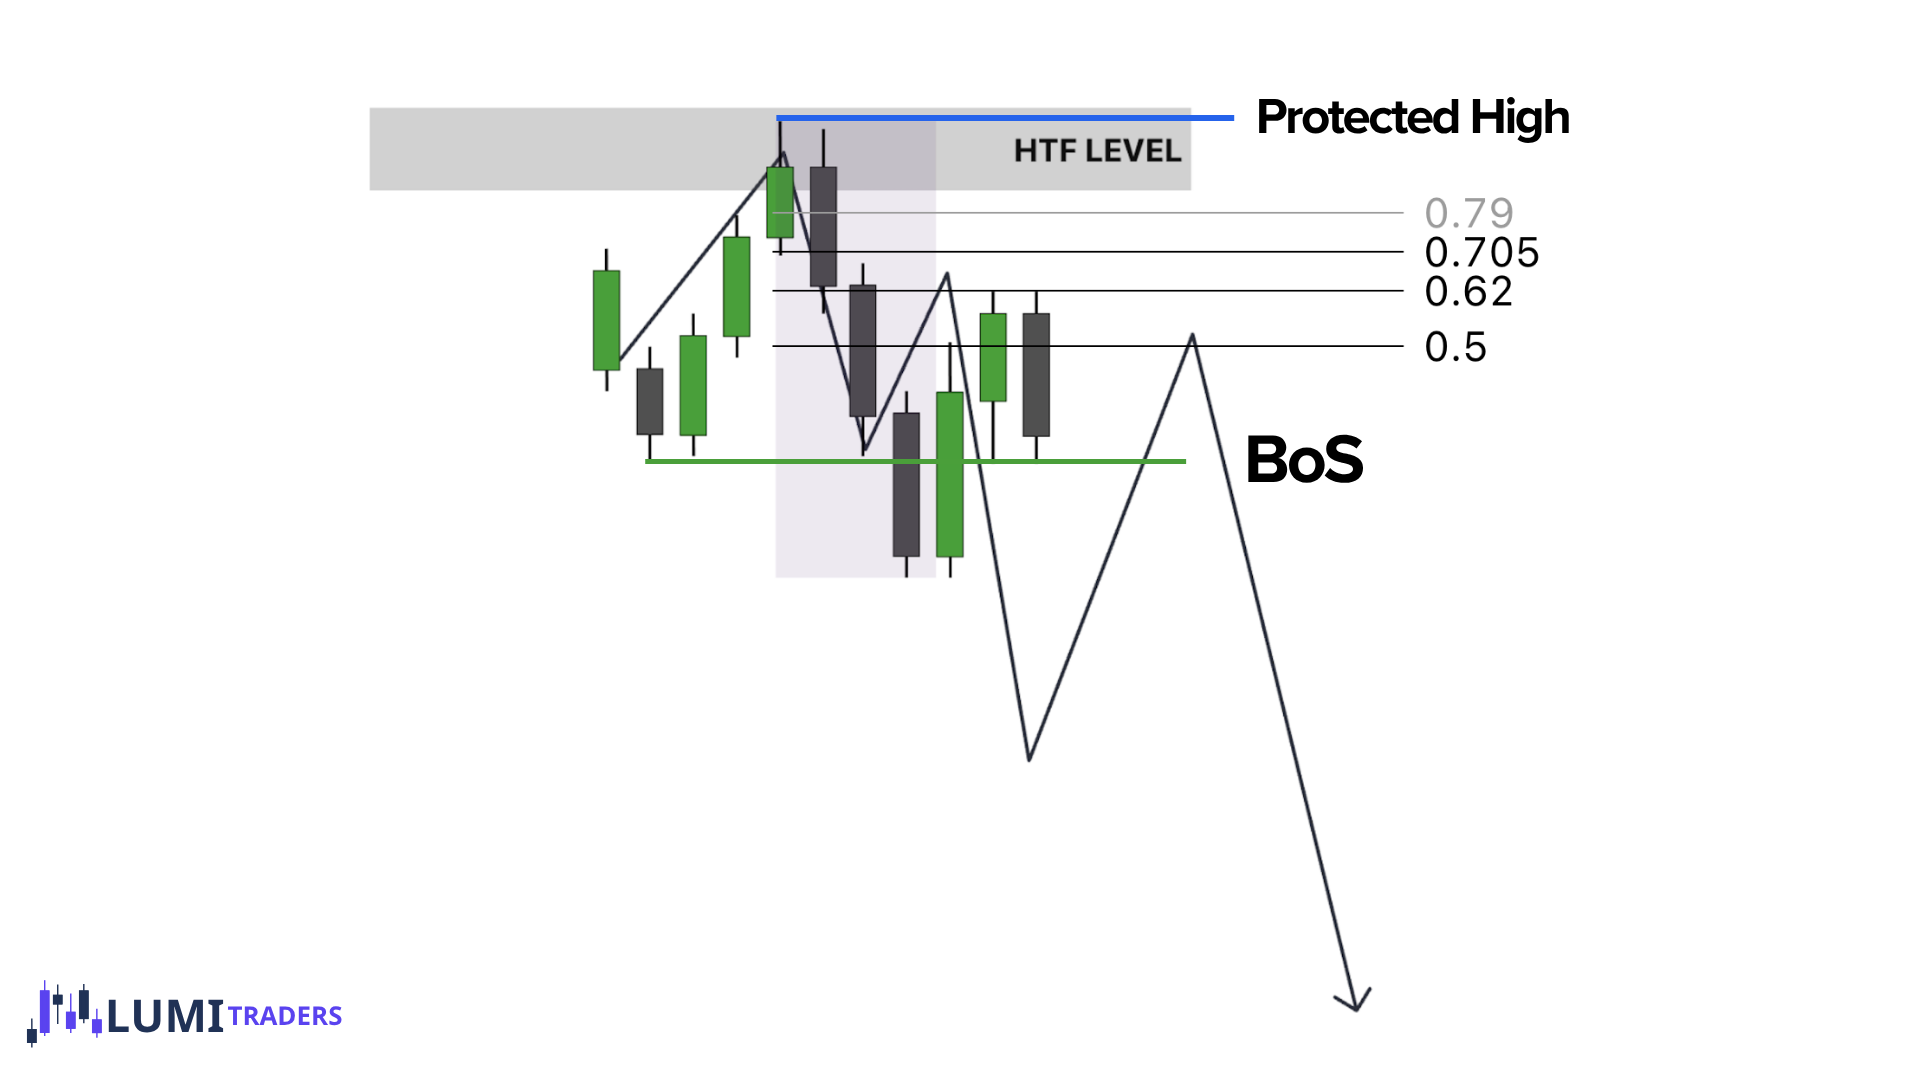
What Do We Expect After BOS?
A common beginner mistake is buying immediately after a bullish BOS or selling immediately after a bearish BOS.
But after price has already expanded, the trade can become expensive.
Instead, after a valid BOS, we often expect:
Pullback → continuation
This gives us the basic structural cycle:
BOS → Pullback → Continuation → New BOS
Suppose price closes above the previous high.
Valid bullish BOS.
Now:
We identify the impulse leg that created the BOS.
We wait for price to retrace.
We prefer the retracement to enter Discount.
Ideally, price may reach OTE.
A Higher Low forms.
Price continues higher.
Price creates another valid bullish BOS.
So:
BOS ↑ → Discount/OTE → HL → BOS ↑
What Is Premium and Discount?
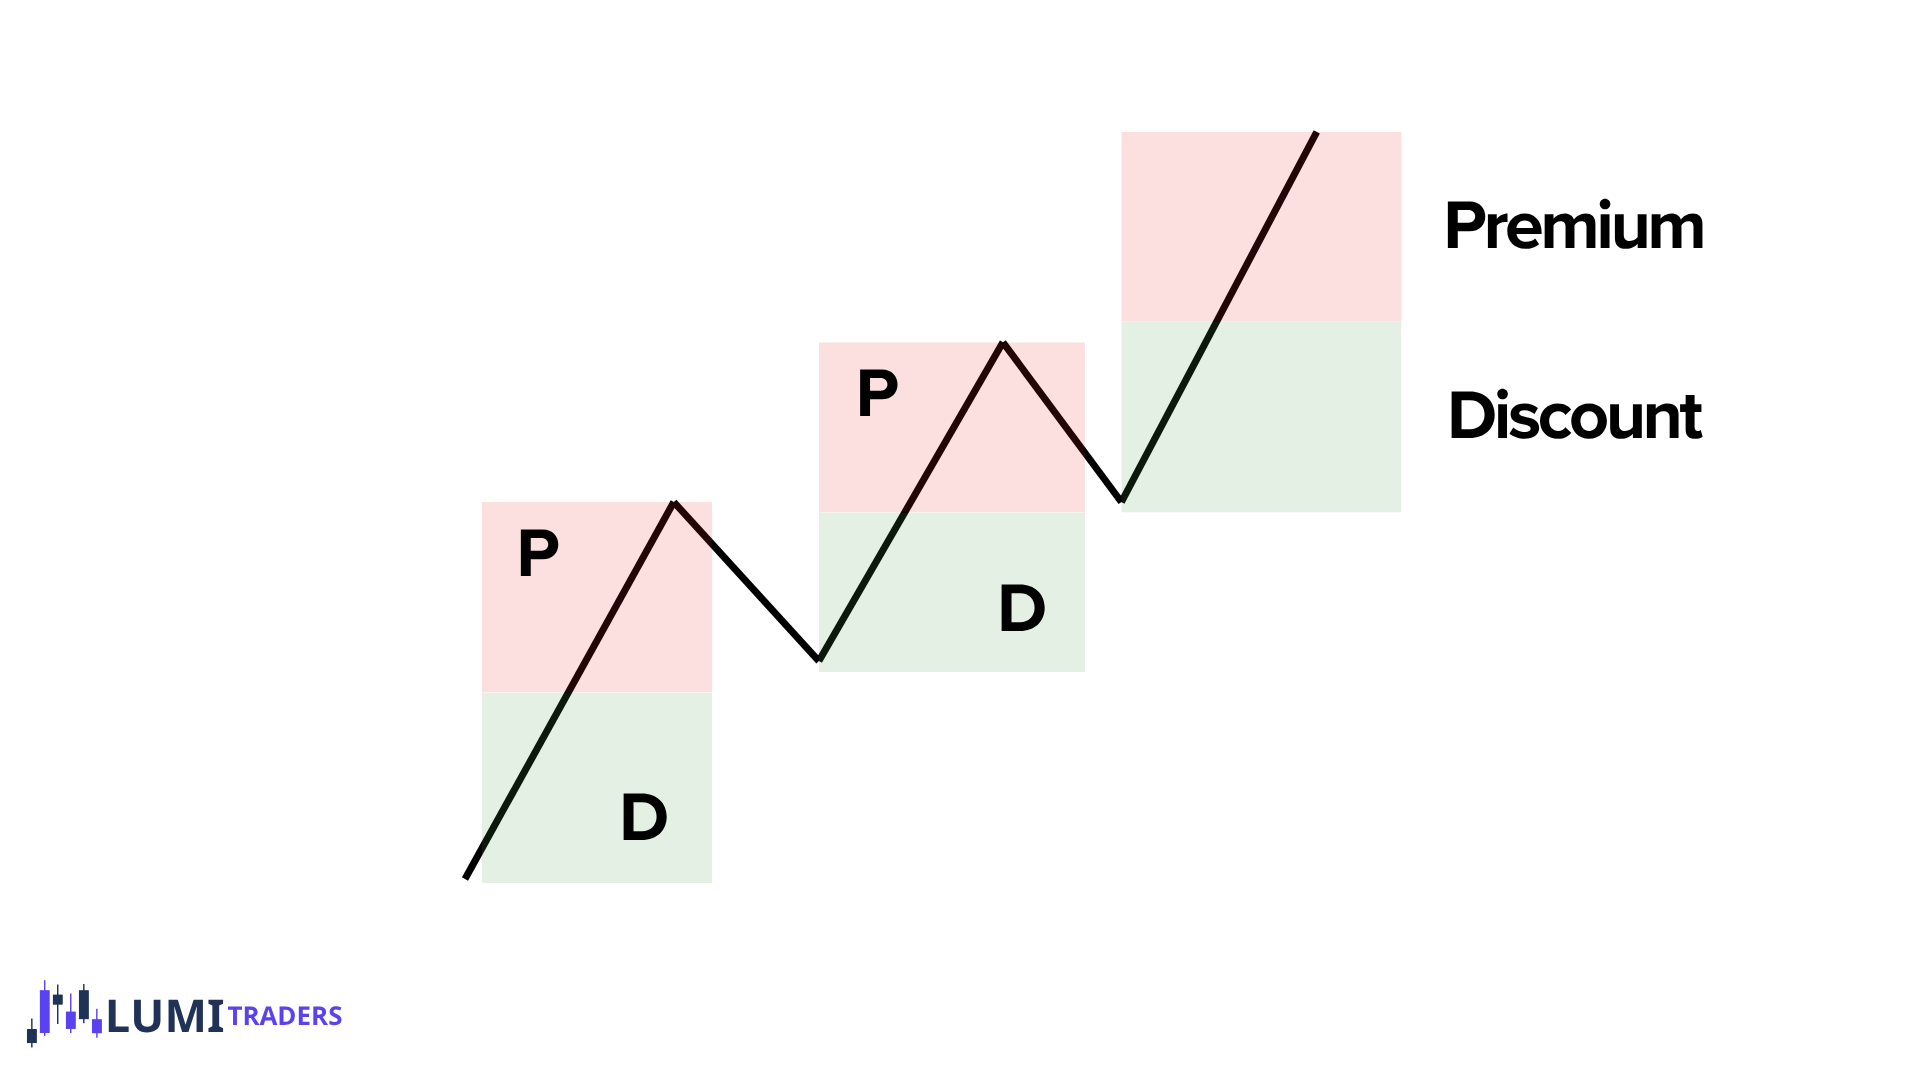
Imagine a dealing range between a meaningful low and high.
The upper half is:
Premium
The lower half is:
Discount
If we are bullish, we generally prefer to buy from:
Discount
If we are bearish, we generally prefer to sell from:
Premium
This helps us avoid chasing price after expansion.
What Is a Pullback?
A pullback is simply price temporarily moving against the current trend.
In bullish structure:
Price moves lower before continuing higher.
In bearish structure:
Price moves higher before continuing lower.
But not every tiny retracement should become a structural HL or LH.
We want a:
Valid Pullback
Why Do We Need Valid Pullbacks?
If we label every tiny zig-zag as a new structural point, the chart becomes meaningless.
A valid pullback helps us decide:
Which swing matters
Which low can become a HL
Which high can become a LH
Which swing can eventually become protected
How many meaningful structural legs have formed
So a valid pullback helps clean up the structure.
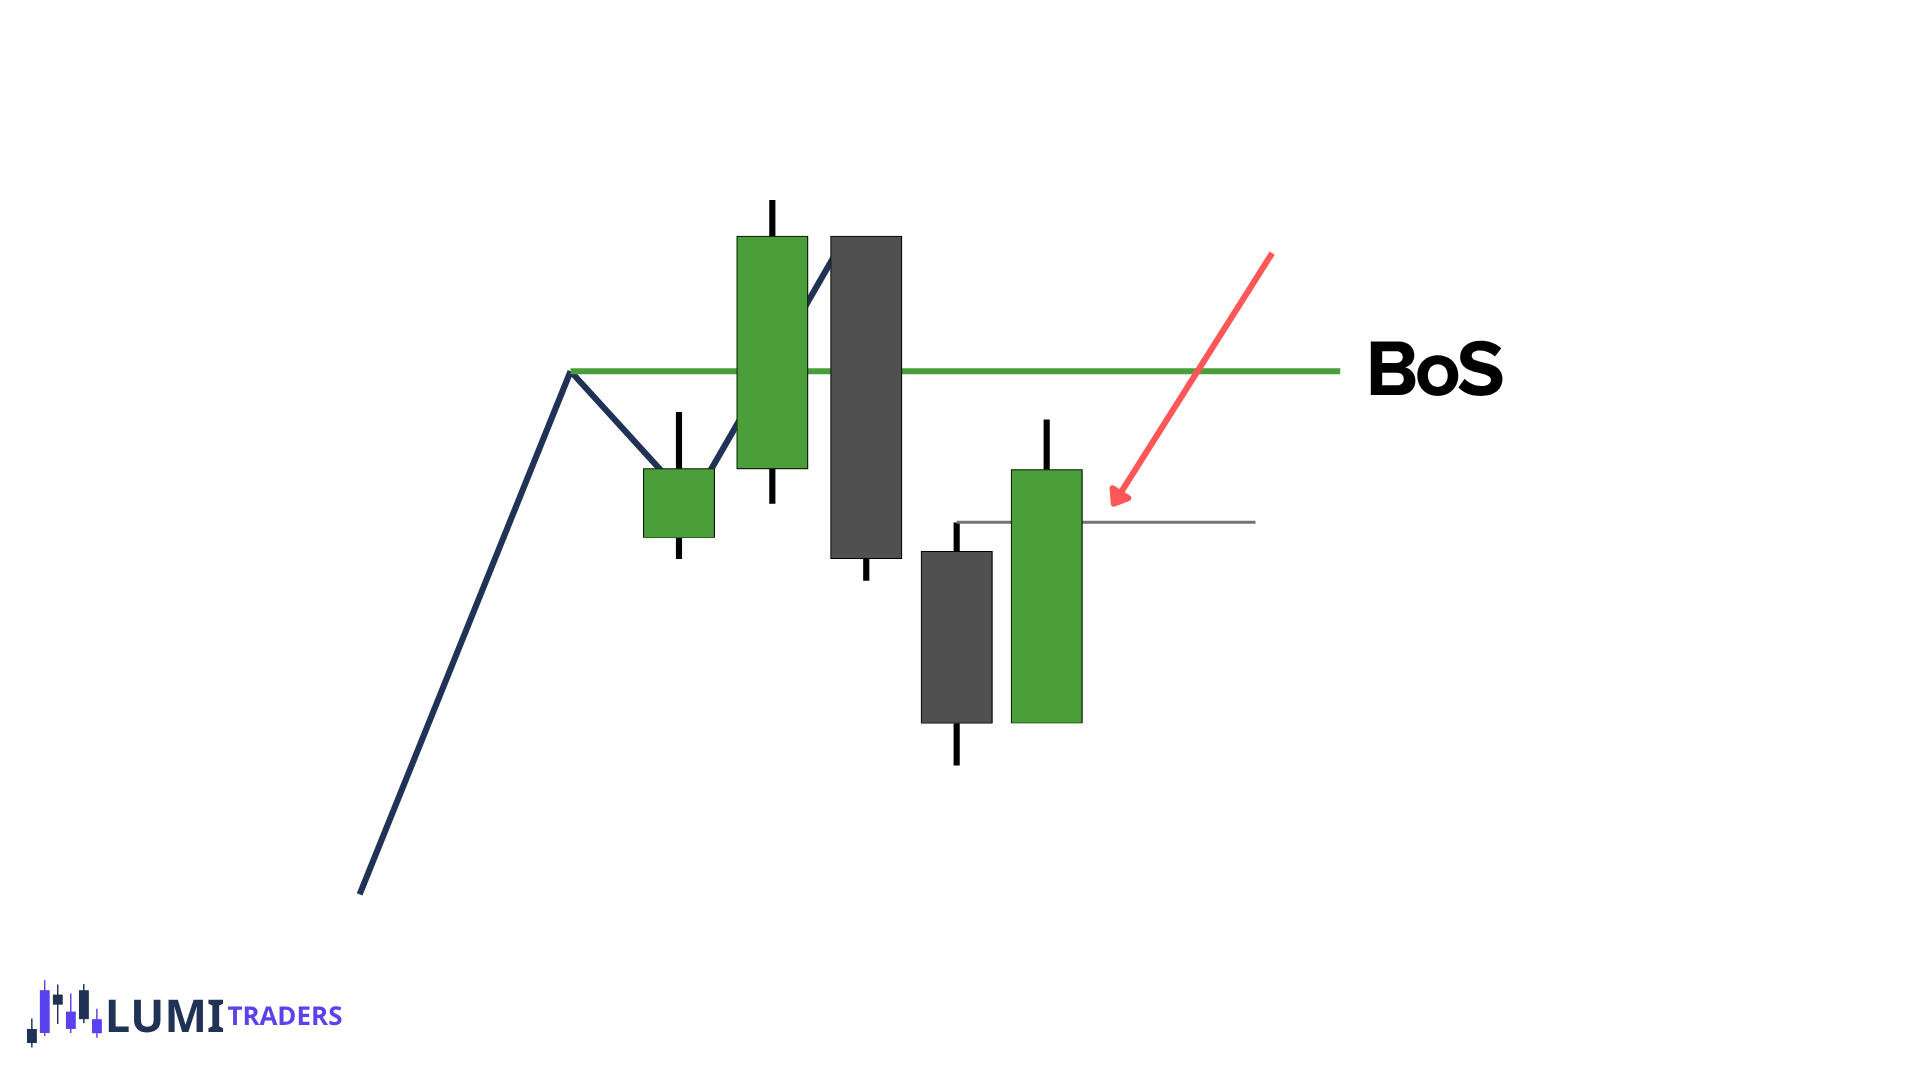
Suppose bullish BOS has already occurred.
Price begins retracing lower.
During the retracement, bearish/down-close candles form.
We want to identify the relevant bearish candle that actually produces the pullback low.
For the bullish pullback to become valid, we want price to close back above the relevant high of that bearish/down-close candle.
Now we have evidence that the bearish pullback has ended and bullish delivery is returning.
Conceptually:
Bullish BOS
→ bearish pullback
→ pullback low forms
→ bullish closure above relevant bearish candle
→ Valid Pullback
That low can now become a potential structural HL.
The Pullback Does Not Become Protected Immediately
This is important.
A Valid Pullback may create a potential HL or LH.
But that point does not automatically become a protected swing.
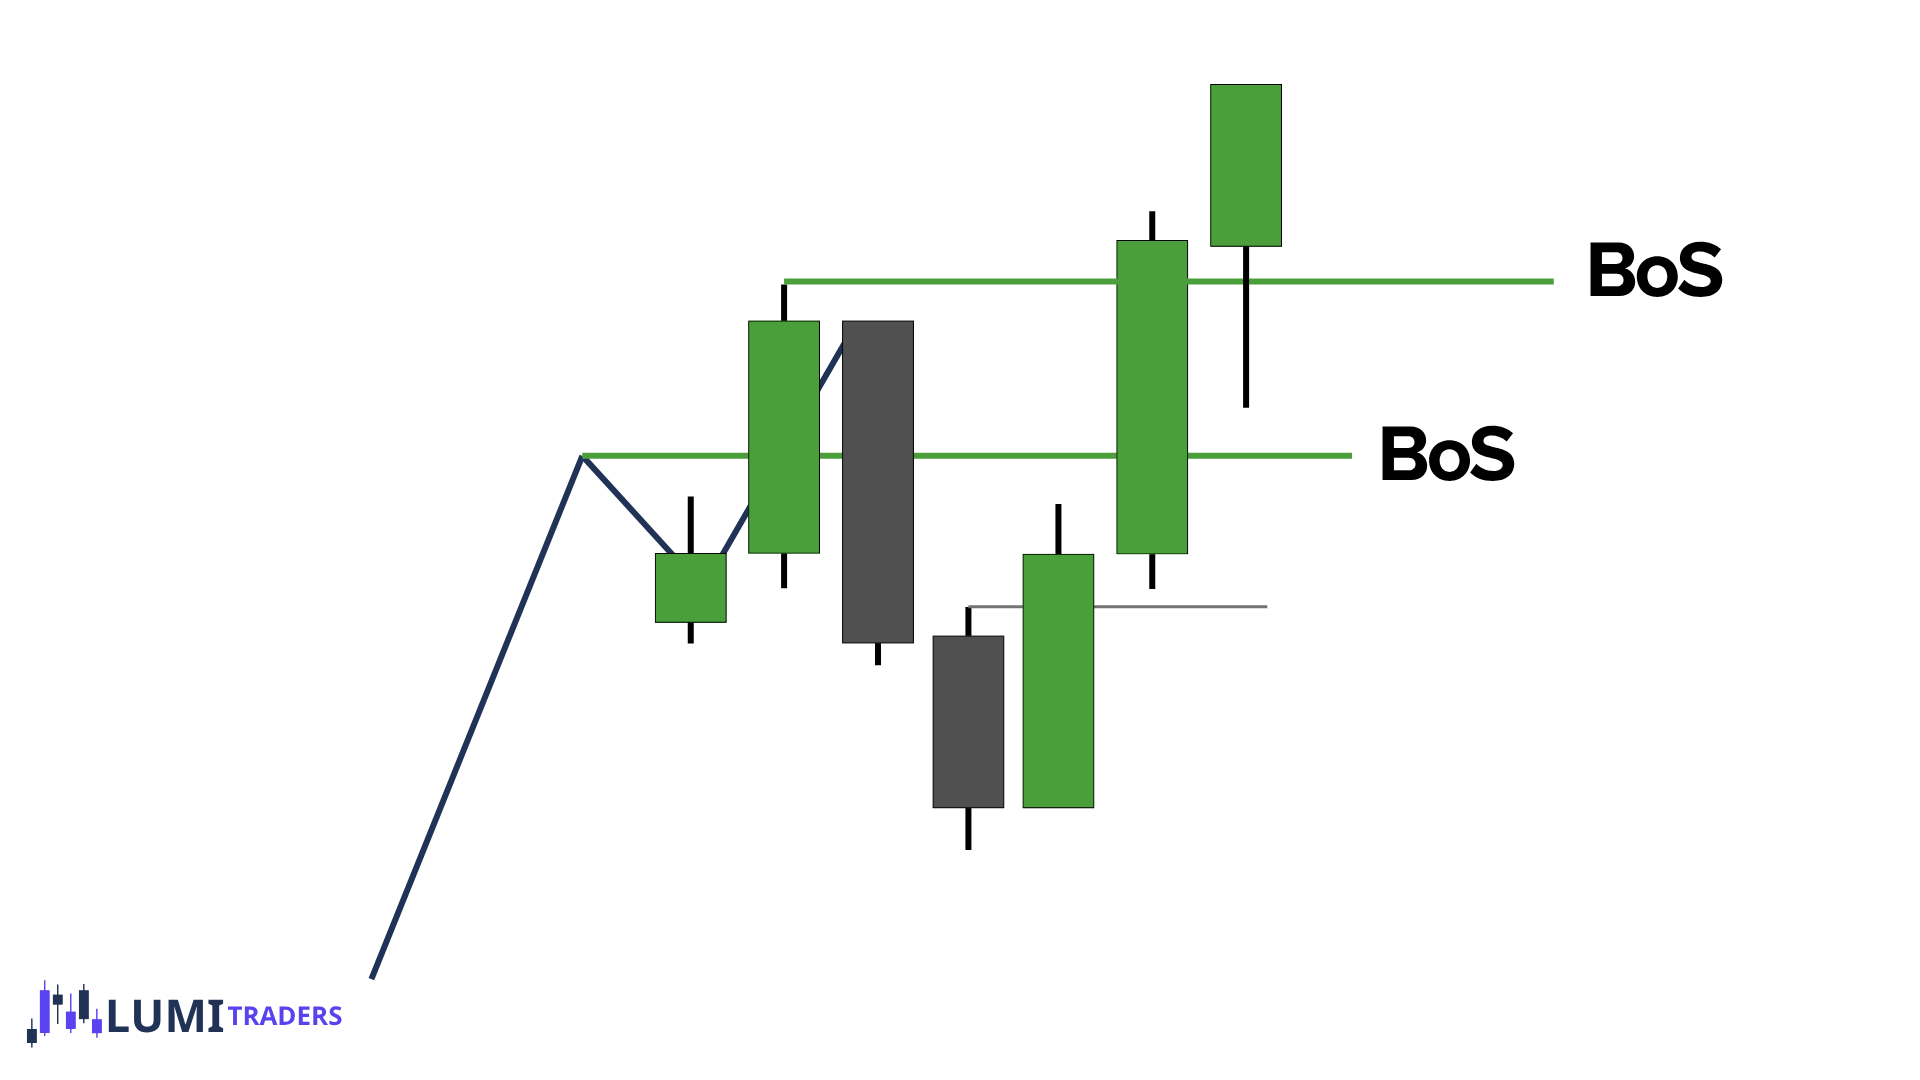
It becomes protected only if the continuation from that point produces:
Valid BOS
Example:
Bullish market:
Valid Pullback Low → rally → close above previous High
Now that pullback low can become:
Protected Low
So there are steps.
The Structural Sequence
For bullish structure:
Valid BOS
→ Valid Pullback
→ potential HL
→ new Valid BOS
→ HL becomes Protected Low
For bearish structure:
Valid BOS
→ Valid Pullback
→ potential LH
→ new Valid BOS
→ LH becomes Protected High
This is much cleaner than labeling every local pivot.
What Happens When a Trend Fails to Continue?
This is where market structure becomes much more useful.
A trend has a job.
Bullish Trend
Price should continue taking highs.
Bearish Trend
Price should continue taking lows.
If price fails to do what the trend should do, that failure is information.
For example,
Normal bullish structure:
HL → HH → HL → HH
Price pulls back.
Then rallies.
The expectation is:
new HH
That means price should take the previous high and obtain a valid close above it.
If it does:
Bullish structure continues.
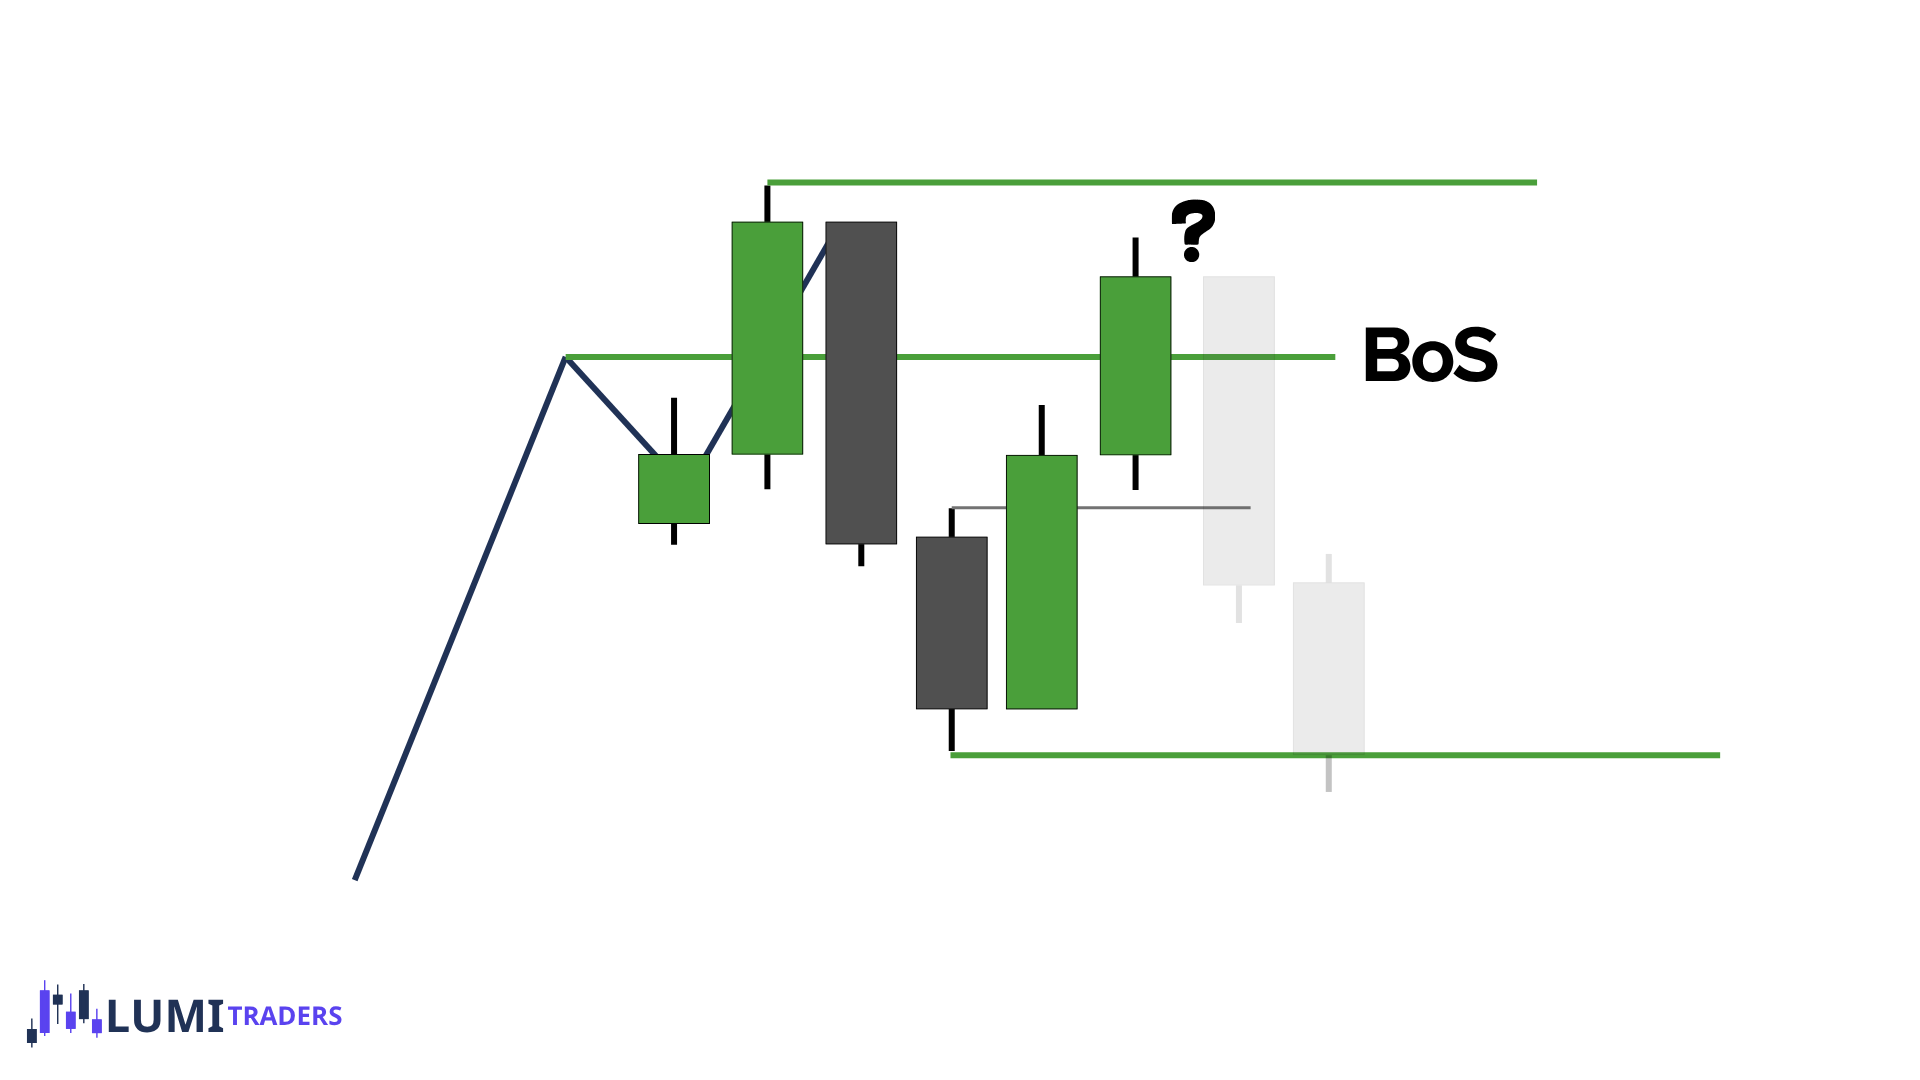
Now imagine price rallies toward the previous high.
But:
It stops below the high, or
It sweeps the high but does not close above it
Now we do not have a new valid bullish BOS.
The expected bullish continuation failed.
This is where we begin paying attention to a:
Valid High
What Is a Valid Swing?
Note: same idea applies for Valid Low
A Valid High is an important high that becomes confirmed after bullish delivery fails.
One way this develops:
Price is trying to continue bullish.
It creates or attempts a new high.
Bullish continuation fails.
We identify the relevant last up-close/bullish candle responsible for creating that high.
Price closes below that candle.
The high becomes a Valid High.
This tells us that the delivery creating the high has been invalidated.
Now the market may seek liquidity in the opposite direction.
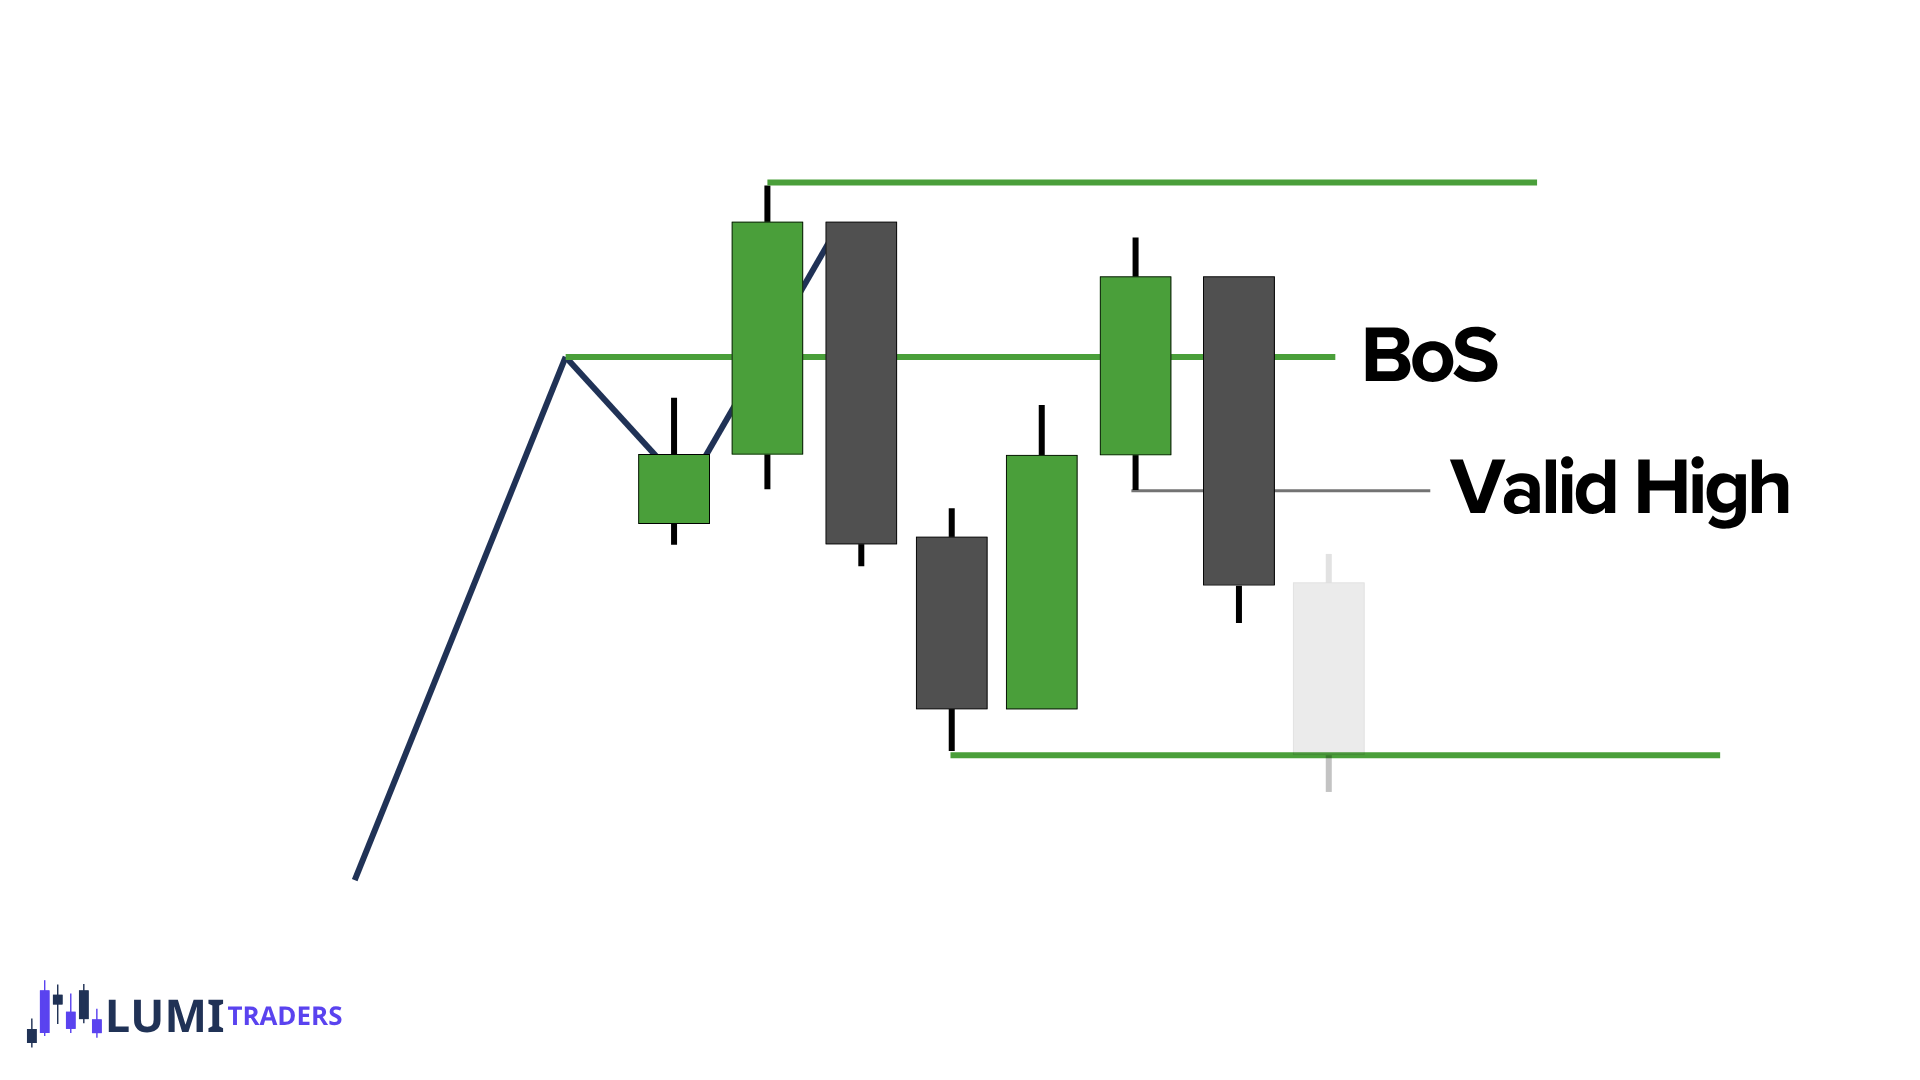
Suppose we have bullish structure.
Previous important high exists.
Price rallies.
But it cannot produce a valid close above that high.
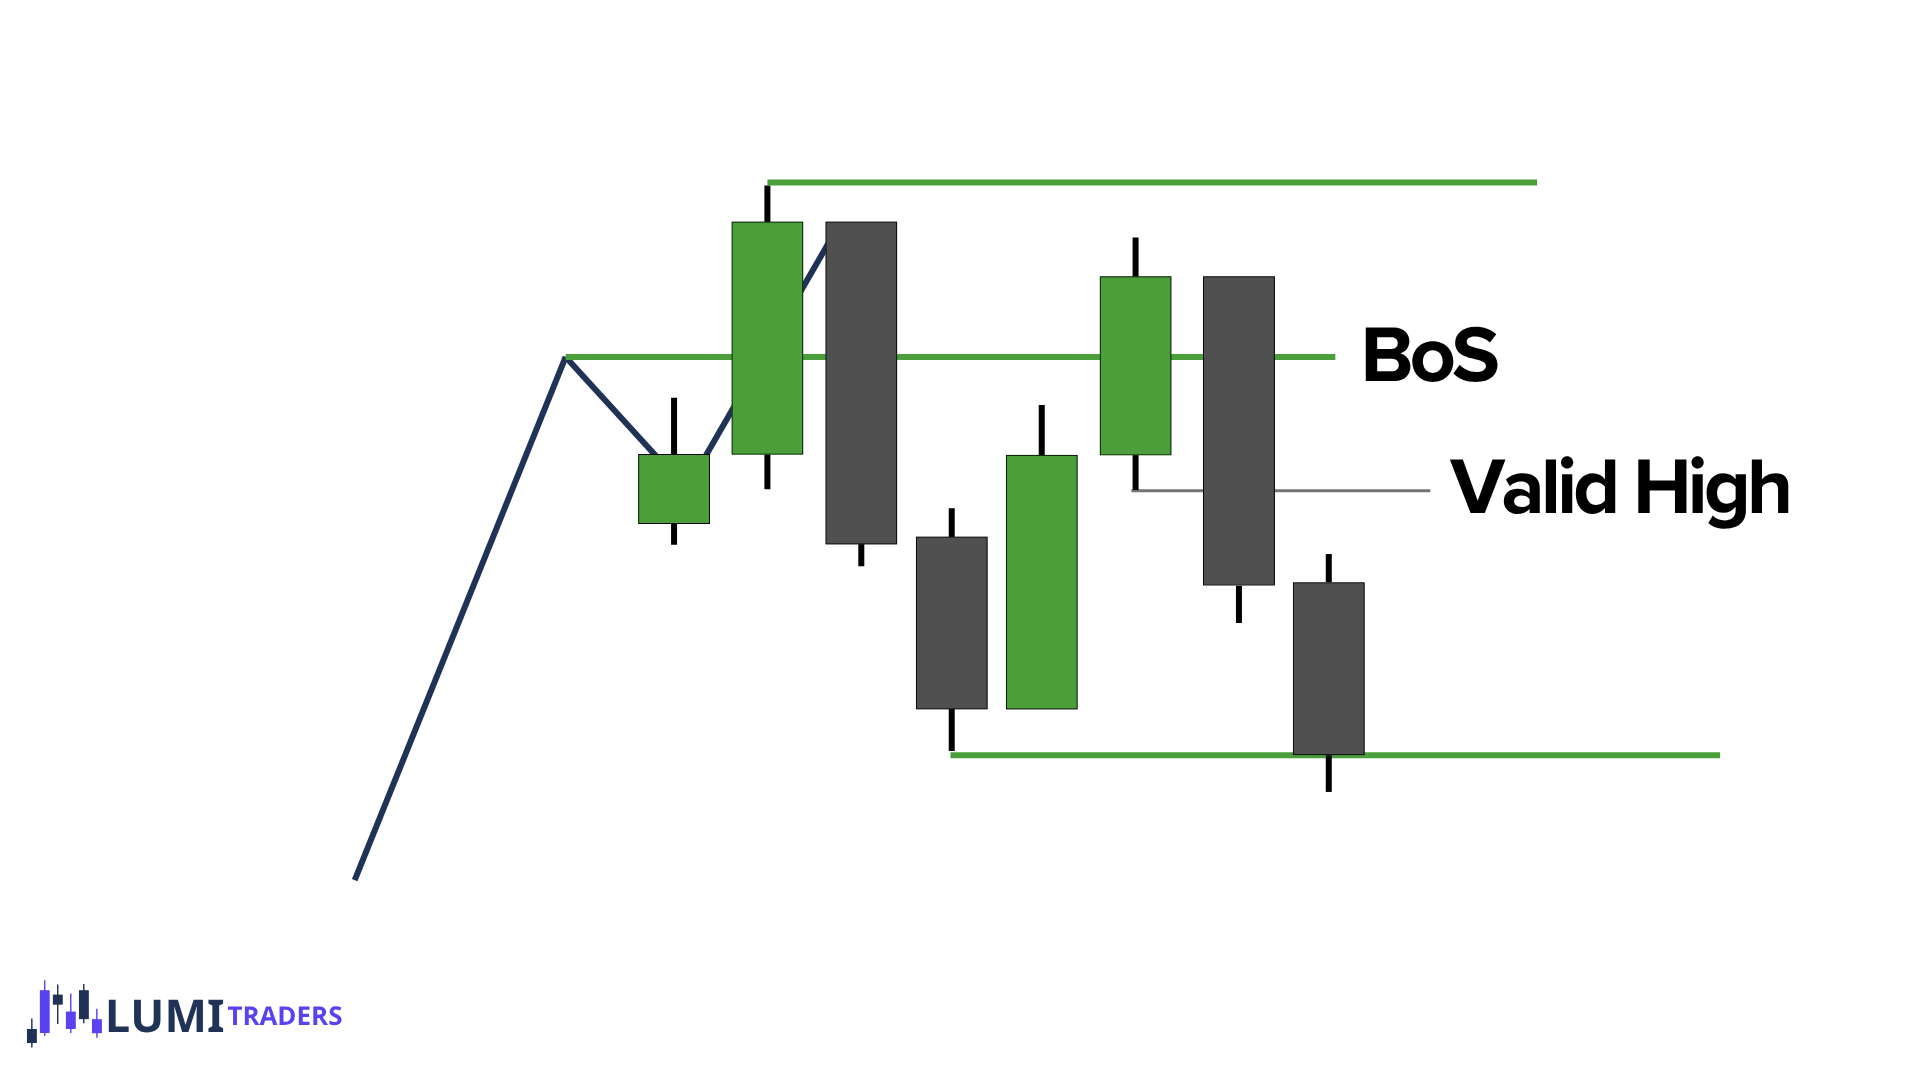
Then bearish delivery begins.
Price closes below the last meaningful up-close candle that produced the failed rally.
Now:
Valid High
This becomes a warning:
Bullish continuation failed. Price may now seek Sell-Side Liquidity.
What Could the Opposite Liquidity Be?
After a Valid High, potential downside objectives can include:
Internal SSL
Previous swing low
Protected Low
Equal lows
Opposite side of the range
HTF liquidity objective
Which level matters depends on the timeframe and larger structure.
Does a Valid High / Low Automatically Mean Bearish / Bullish Trend?
No.
This is very important.
A Valid High tells us:
The current bullish continuation attempt failed.
A Valid Low tells us:
The current bearish continuation attempt failed.
It does not automatically mean the entire HTF structure has reversed.
For full bearish/bullish structural confirmation, price may still need to break a meaningful protected low/high.
So:
Valid High/Low = early warning
Protected Low/High break = much stronger structural shift
Valid High/Low = warning.
Protected High/Low = structural confirmation.
A Very Important Failed Continuation Model
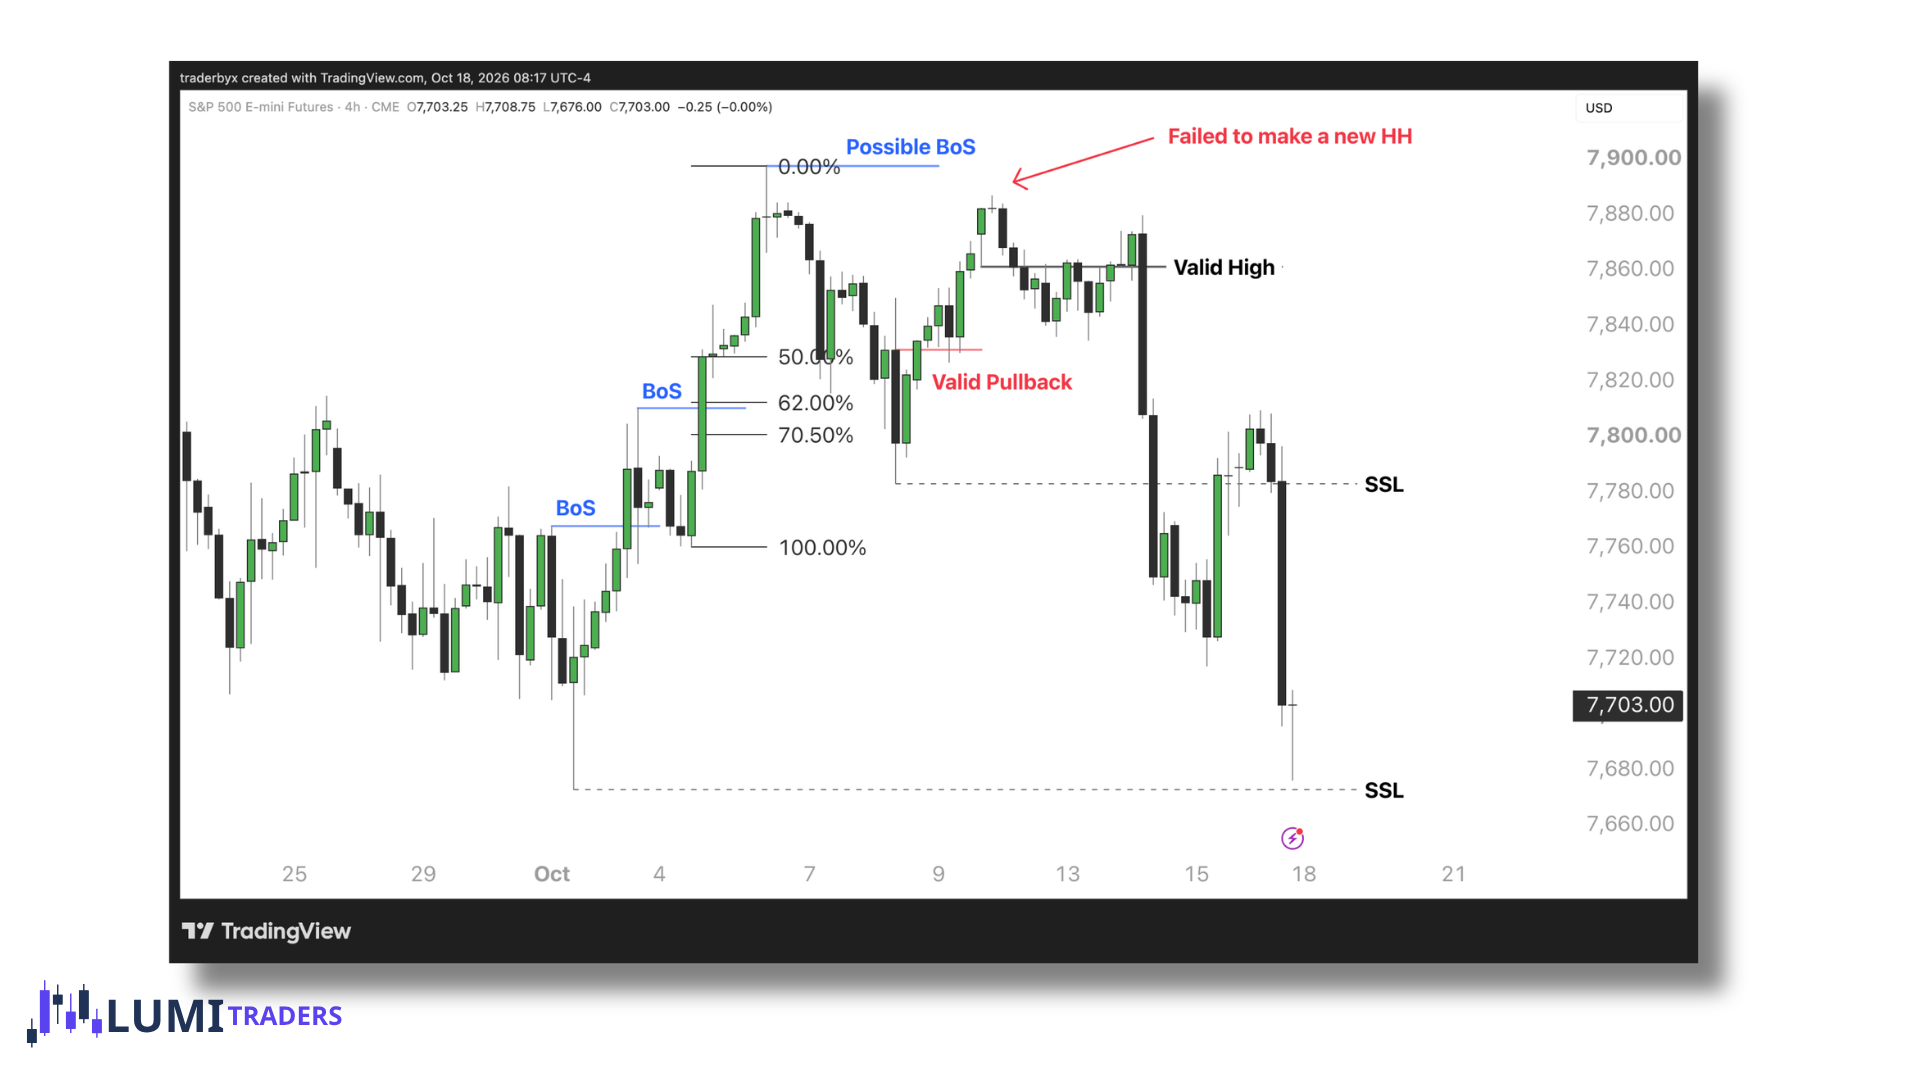
Bullish Failure
Market is bullish.
We expect new HH.
Price fails to make valid HH.
No valid bullish BOS.
Valid High forms.
Now:
Look toward opposite SSL.
Potential sequence:
HH → pullback → failed HH → Valid High → move toward SSL
OR
Market is bearish.
We expect new LL.
Price fails to make valid LL.
No valid bearish BOS.
Valid Low forms.
Now:
Look toward opposite BSL.
Potential:
LL → pullback → failed LL → Valid Low → move toward BSL
The Old Swing Still Matters
This is worth repeating.
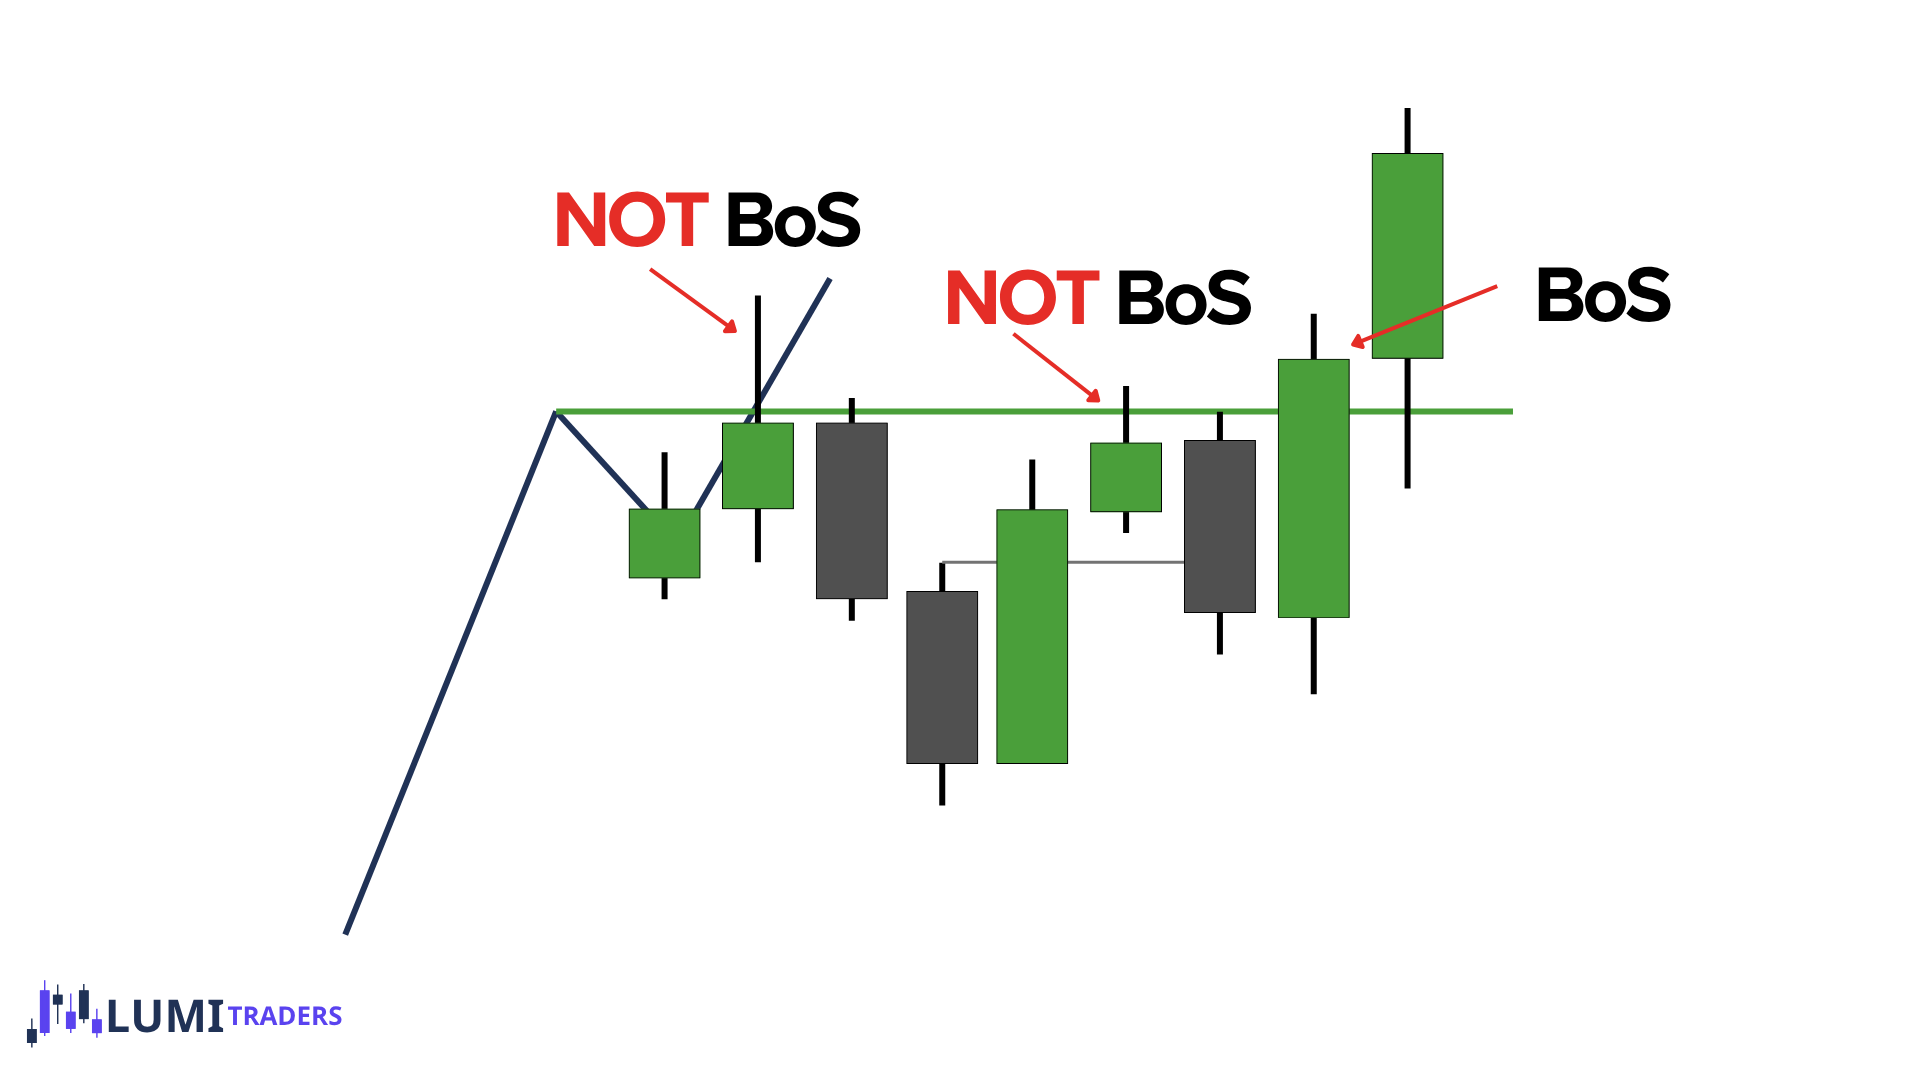
If a high or low is swept but not structurally broken:
keep the original swing marked.
Example:
High is swept.
No bullish BOS.
Later price rallies and finally closes above that same high.
Now:
BOS is valid.
Do not constantly redraw the BOS level around every wick.
When Does a Protected Swing Break?
Suppose we are bullish.
We have a Protected Low.
Price begins moving lower.
If price only wicks below it but closes back above:
That may simply be a liquidity sweep.
If price obtains the required structural closure below:
Now the protected low has been structurally violated.
This becomes important evidence that bullish structure may be transitioning.
The same applies to Protected High.
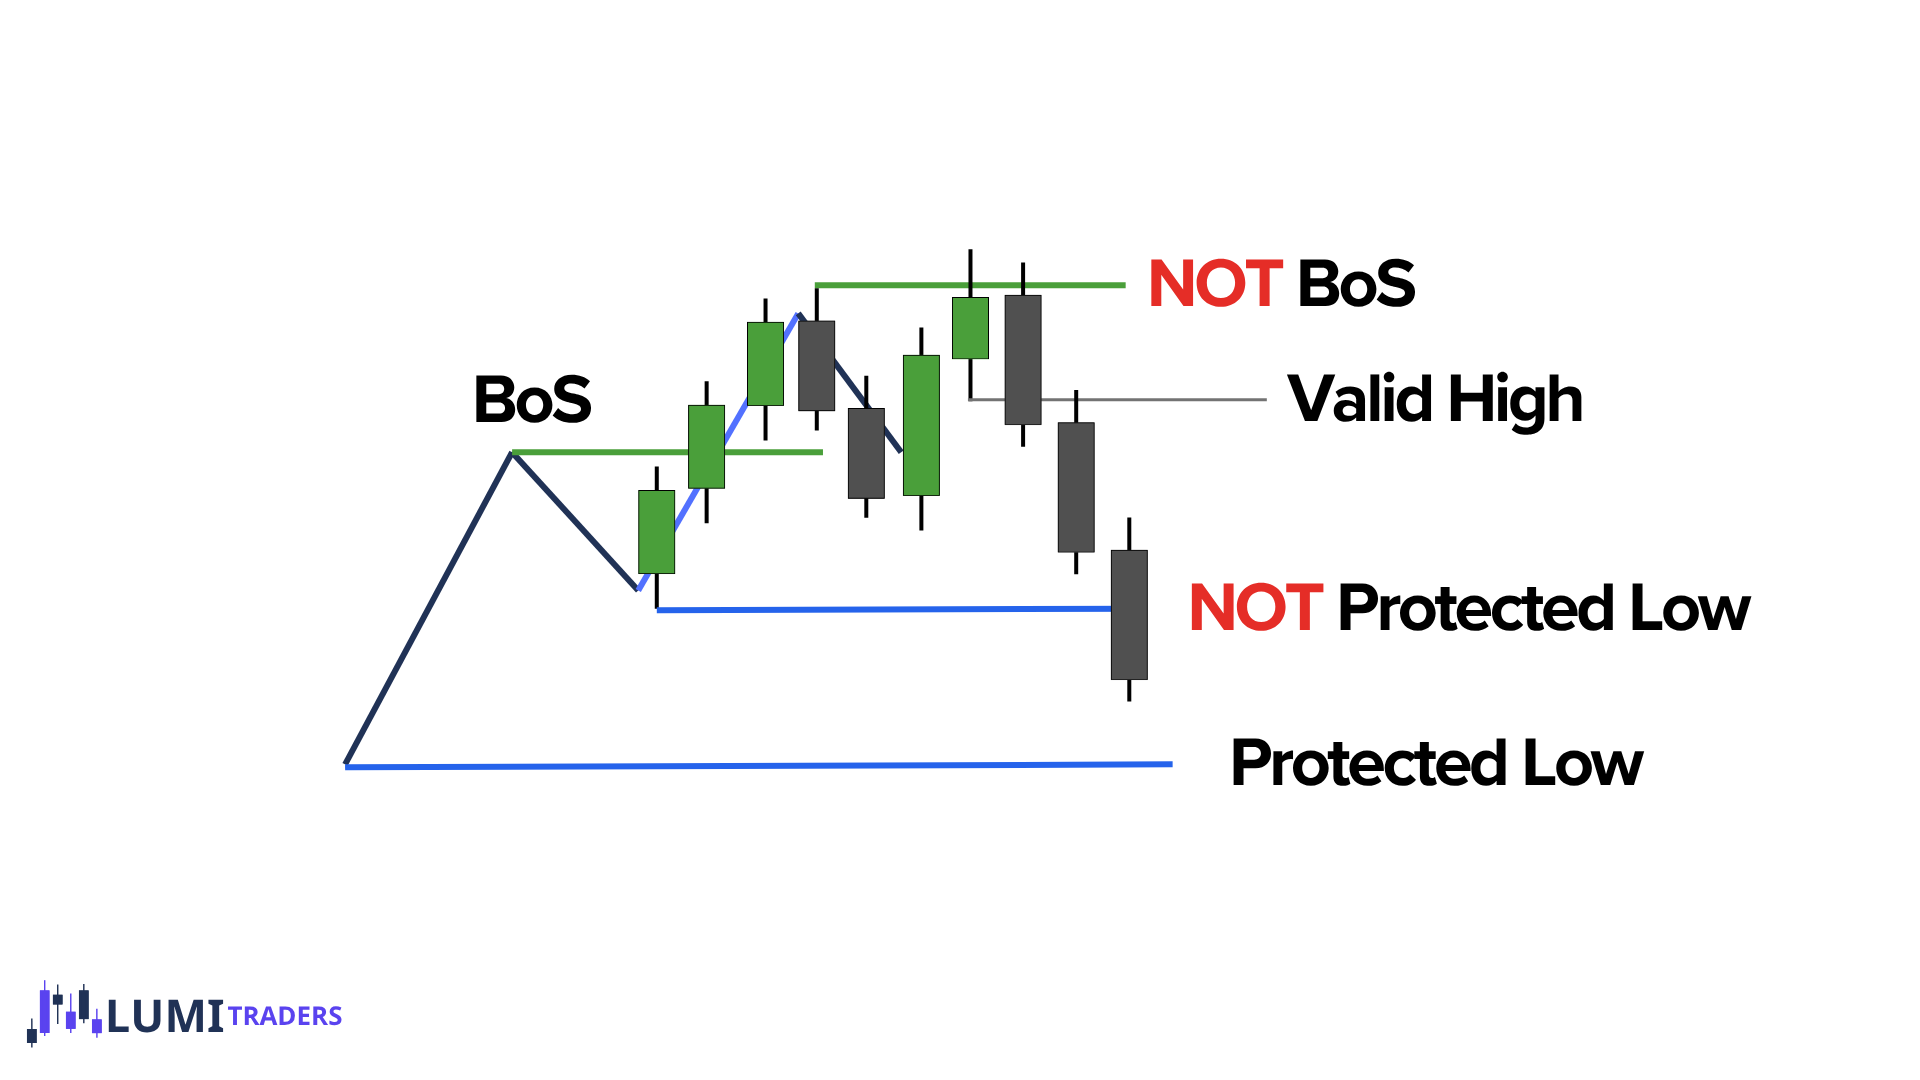
A common transition might look like:
Bullish BOS
→ Protected Low
→ pullback
→ failed attempt at new HH
→ Valid High
→ move lower
→ close below Protected Low
Now we have much stronger evidence that bullish structure has shifted.
Notice how the Valid High often gives us an earlier warning before the protected low actually fails.
Internal Structure vs. Main Structure
Beginners often get confused because lower timeframes contain many tiny highs and lows.
You may see:
Several mini HHs
Several mini LLs
Many tiny structure breaks
inside one larger swing.
Not every one should change your main bias.
Always ask:
Is this internal structure, or is this one of my meaningful protected swings?
A small internal break may simply be part of a pullback.
A break of the actual protected swing is much more important.
Market structure is fractal.
A 3-minute chart can be bullish while the 1-hour chart is bearish.
A 5-minute bearish BOS can simply be the pullback inside a bullish 1-hour trend.
Always know:
Which timeframe's structure am I mapping?
Do not mix every timeframe together.