Before you begin
What you’ll learn
- SPX gap levels and ES execution
- 25%, 50% and 62–70.5% OTE zones
- 2-minute CISD confirmation
- Unfilled gaps and overlap scenarios
What is the LumiTraders strategy?
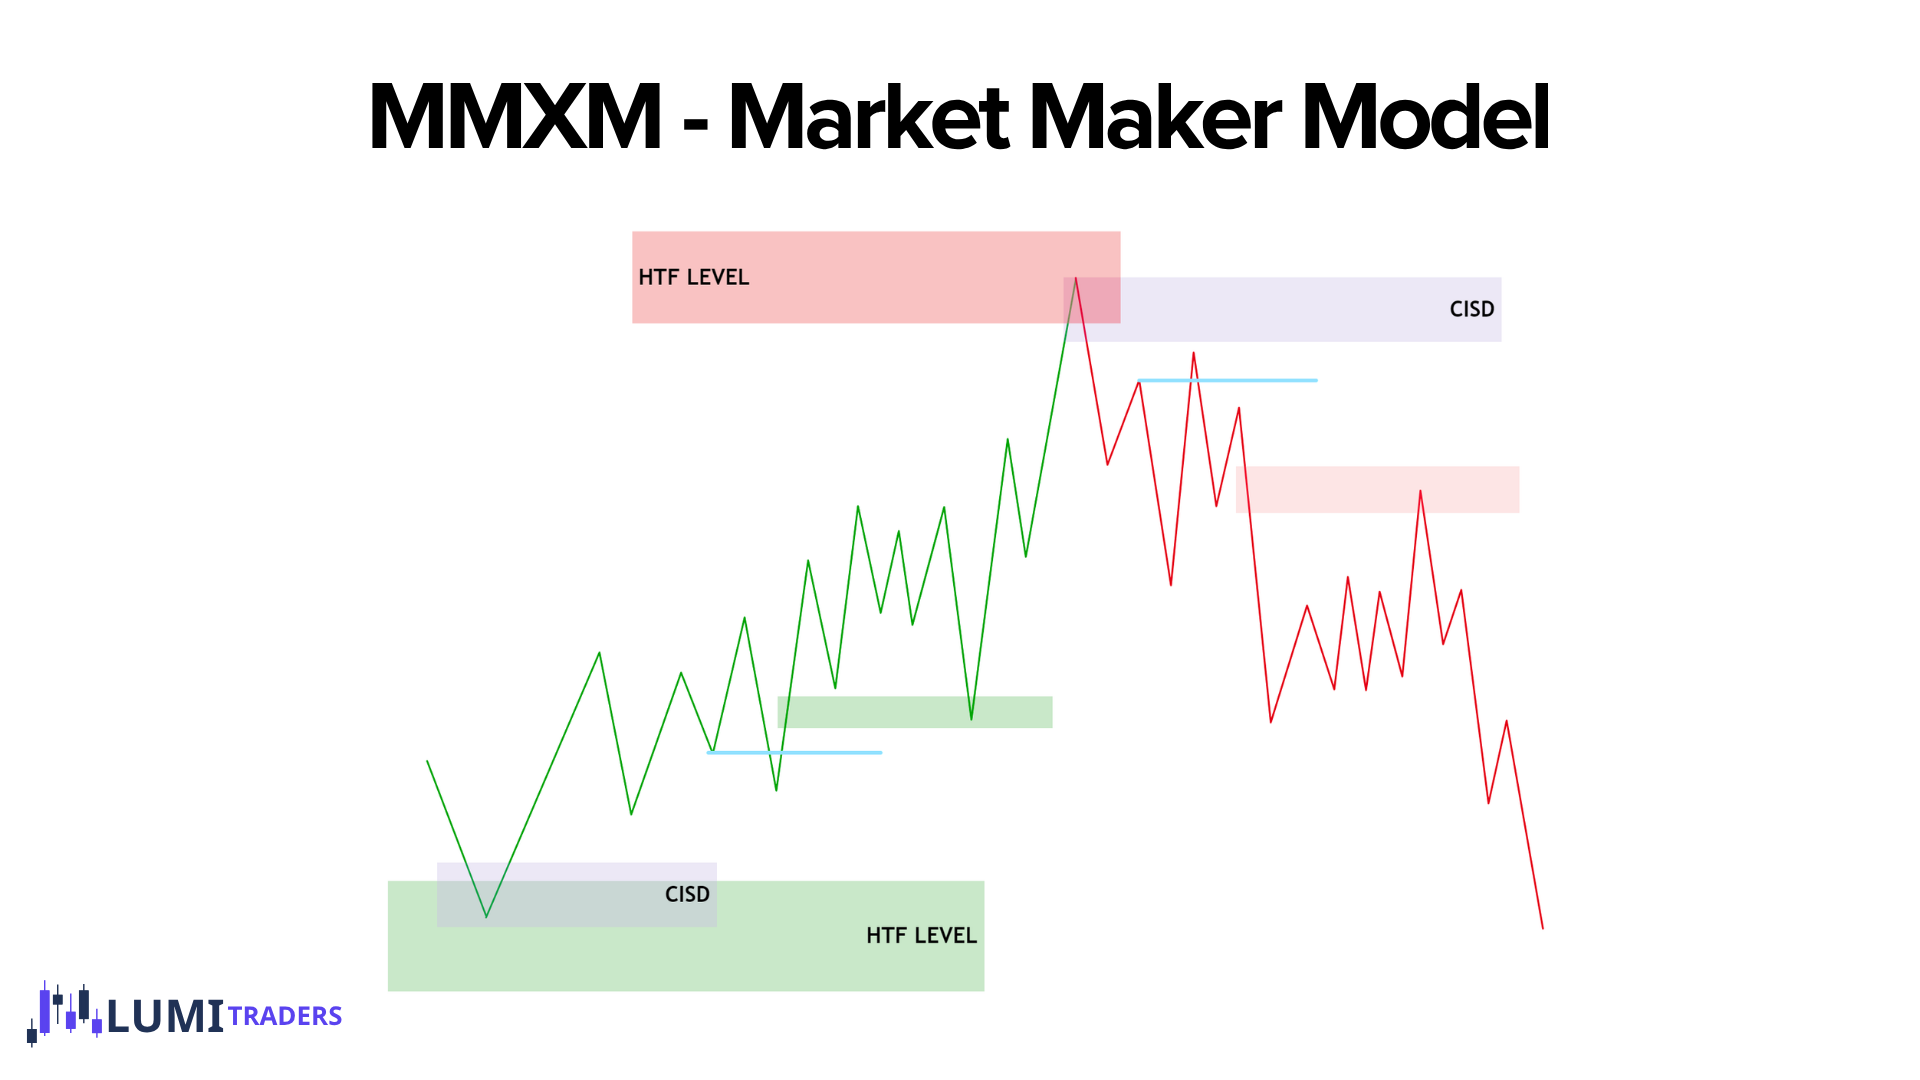
The LumiTraders strategy on this page is my SPX RTH gap setup, which I use every day on my livestreams. I map the gap on SPX, watch the 25%, 50% and 62–70.5% OTE zones, and execute the reactions on ES futures. The levels identify areas of interest; I wait for a 2-minute change in state of delivery (CISD) or market-structure confirmation before entering.
This is my official written strategy lesson. The original chart examples and detailed scenarios follow below.
What is an RTH gap in trading?
An RTH gap is the price difference between a prior regular-session closing reference and the next regular-session open. My LumiTraders setup maps this range on SPX using the prior session’s 4:08 PM chart reference and today’s 9:30 AM opening print, in New York time. The 4:08 PM reference is my strategy setting, not the official 4:00 PM stock-market close.
LumiTraders checklist before an entry
- Map SPX first. Mark the prior-session 4:08 PM reference and the current 9:30 AM open in New York time. Do not substitute an ES futures price for either SPX reference.
- Mark the reaction zones. Draw the 25%, 50% and 62–70.5% OTE levels inside that range. Check whether the new gap overlaps an older unfilled gap.
- Read the context. Locate nearby buy-side and sell-side liquidity and observe whether price takes it in the first 30 minutes. Match the behavior to the scenarios below.
- Wait for confirmation. A touch of a Fibonacci level is not an entry by itself. Wait for the relevant 2-minute market-structure shift or CISD.
- Plan execution and risk. Execute on ES or MES using that contract’s prices and point value. Choose the stop and target for the specific scenario below before sizing the position; SPX and ES need not have identical prices.
- Reassess when the scenario changes. A drive through 70.5% differs from a rejection at OTE. Do not assume that every gap must fill or that a level must hold.
Use this lesson alongside the livestreams. It explains my decision process; it does not establish a verified win rate or guarantee results. Size risk from the ES or MES contract you actually trade, not from an SPX index level.
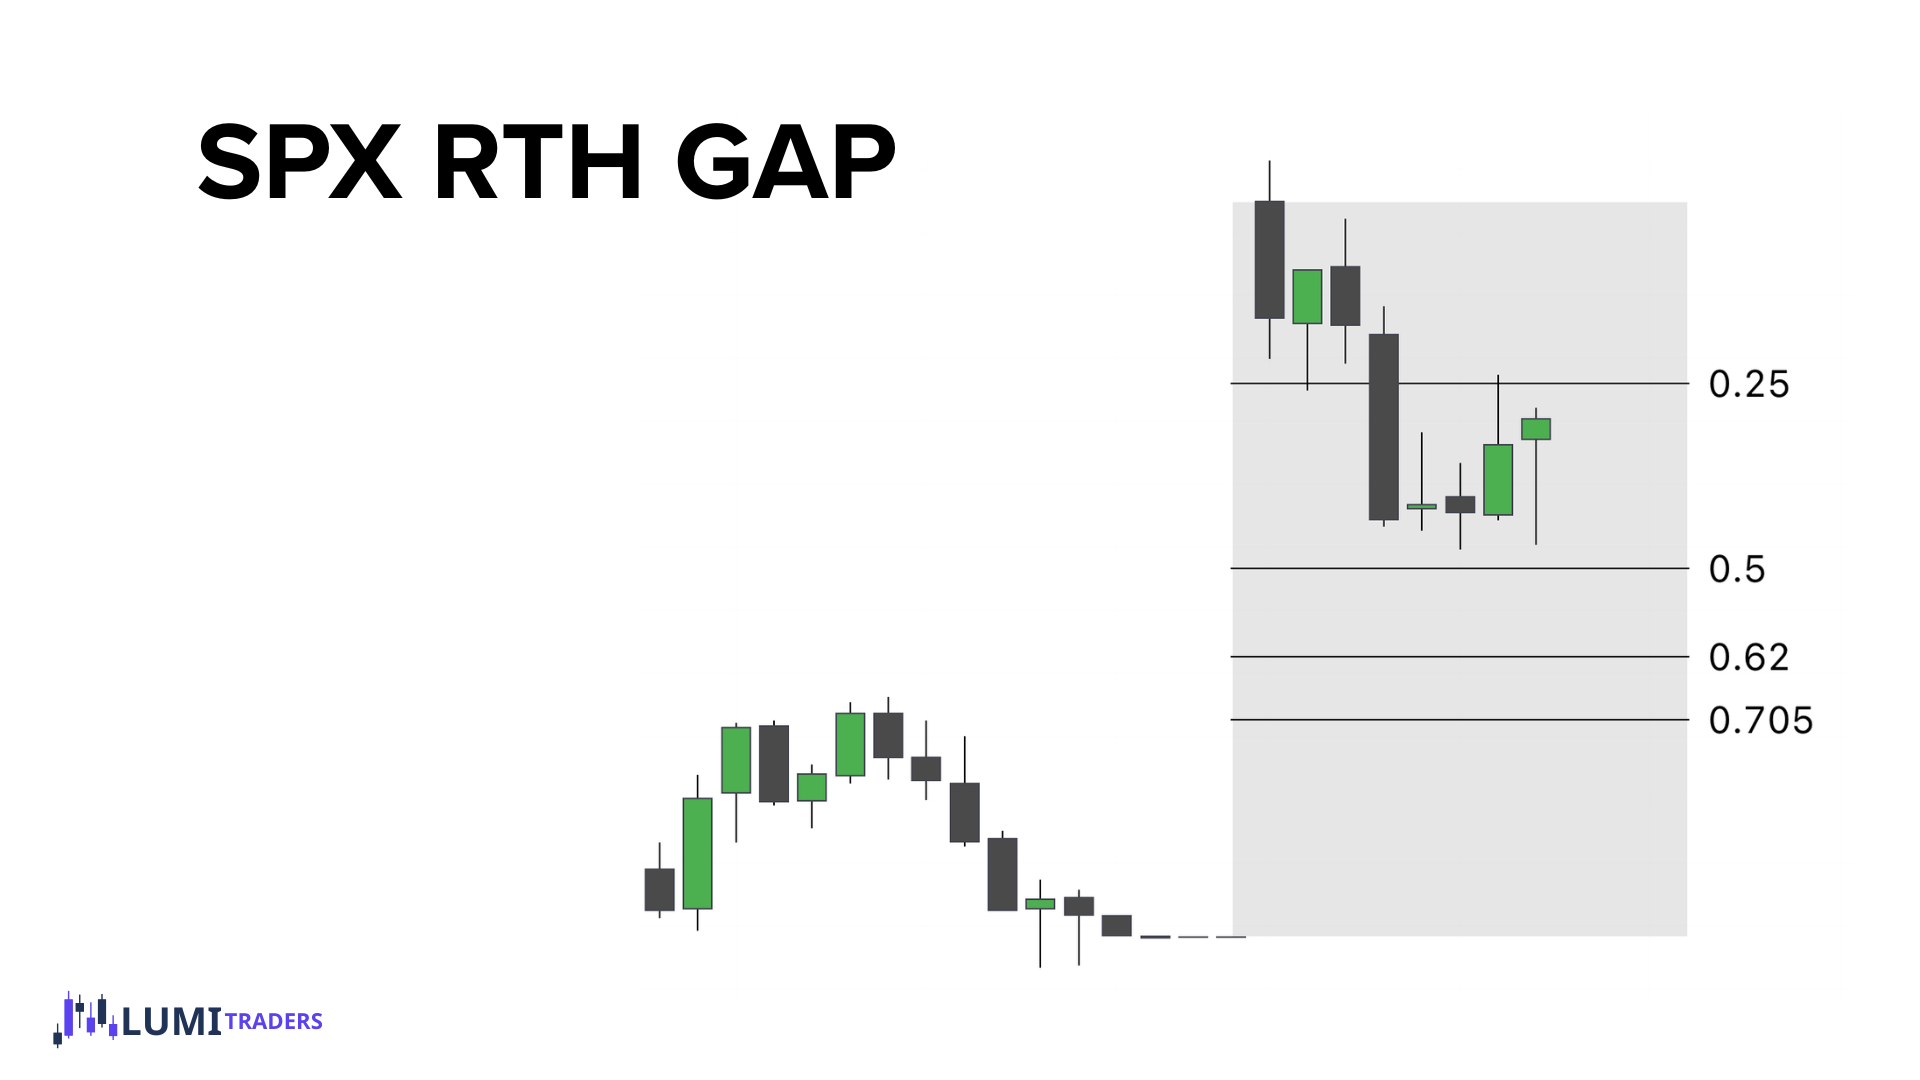
If you trade indices, I highly recommend using the SPX RTH Gap and watching how price reacts from the 25%, 50%, and OTE zones every single day. I track the levels on SPX and trade the reactions on ES — it has been a great addition to my trading.
Chart the levels on SPX (S&P 500 index), execute on ES futures. The gap levels are cleaner on the cash index.
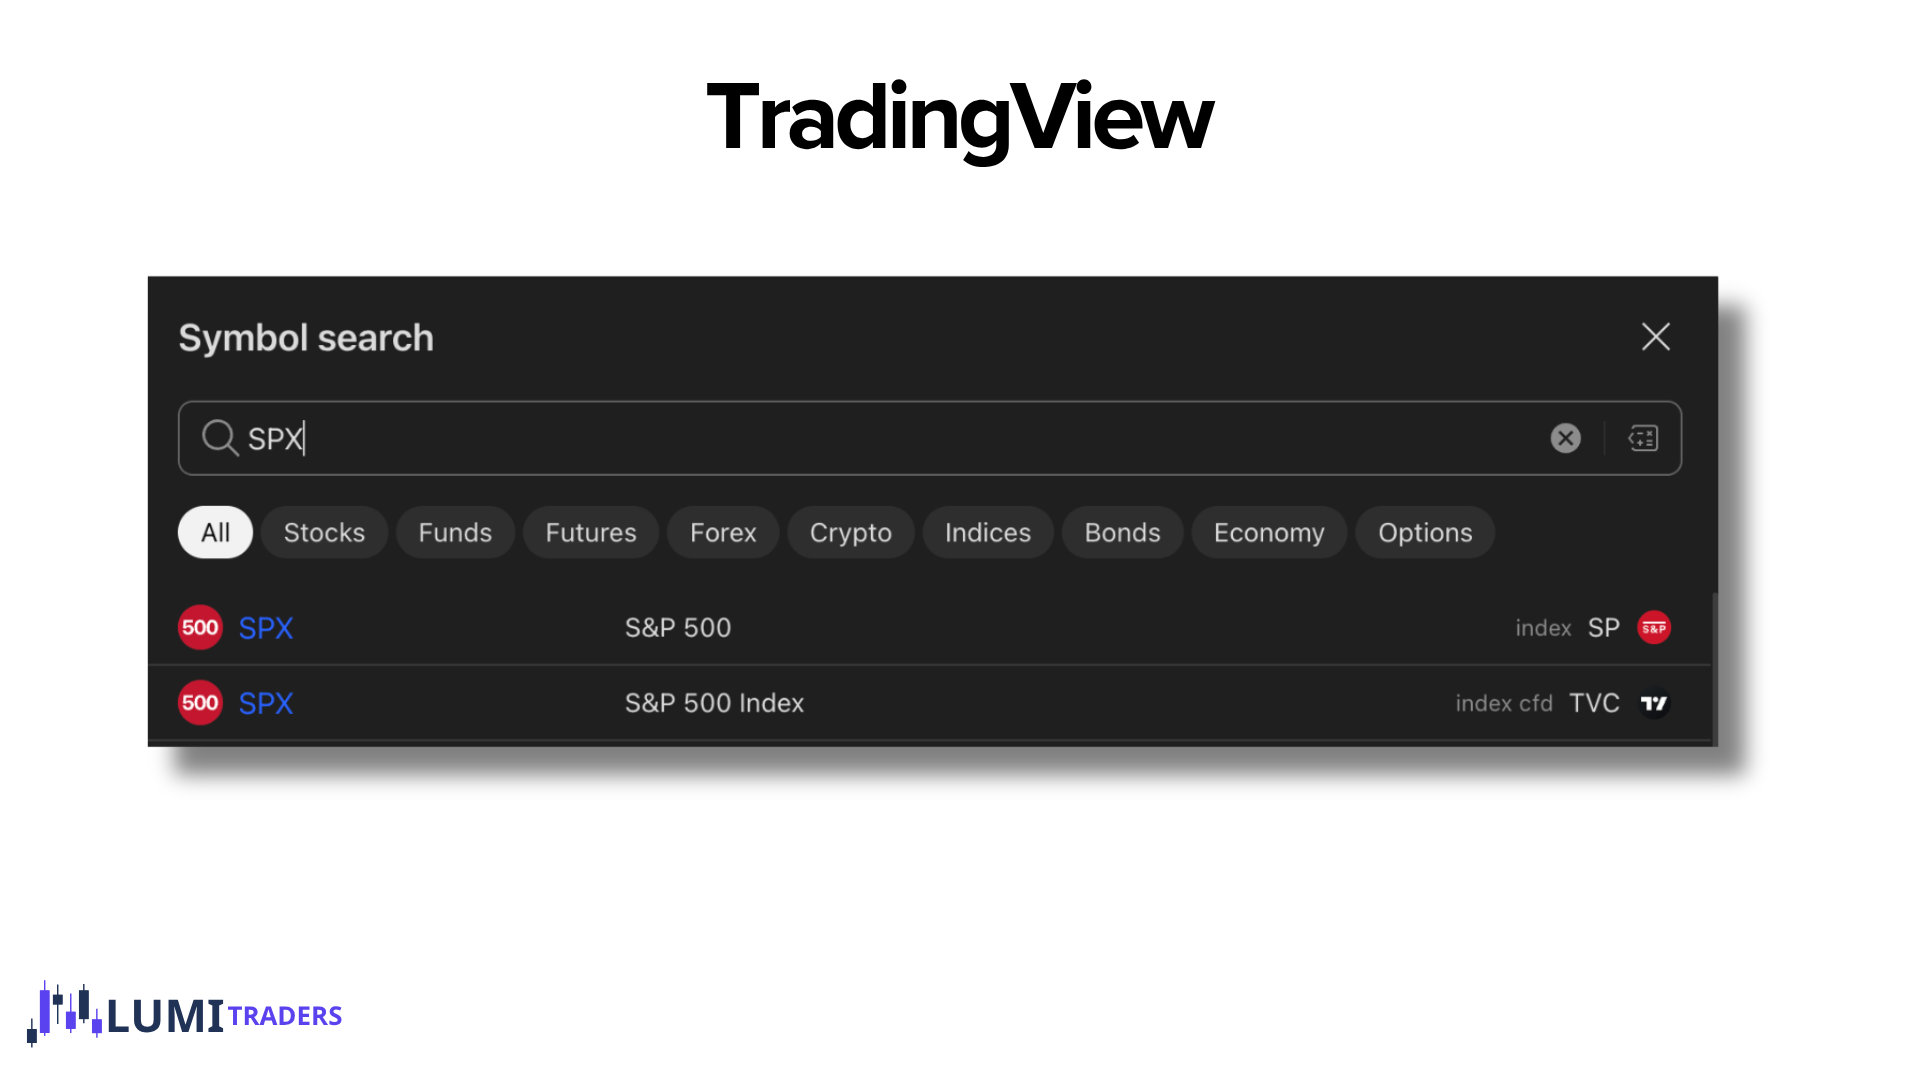
What exactly is SPX?
SPX is the S&P 500 Index.
It represents the value of roughly 500 of the largest publicly traded U.S. companies, including companies such as Apple, Microsoft, Amazon, Nvidia, Meta, etc.
Think of SPX as a scoreboard.
If SPX is:
SPX = 6,700
that number represents the calculated value of the S&P 500 index.
You cannot buy "one SPX" like a stock.
You can, however, trade products based on it, such as:
SPX options
ES futures
MES futures
SPY ETF
What is ES?
ES is the E-mini S&P 500 futures contract.
Its price is based on the S&P 500, so ES and SPX normally move almost identically.
For example:
SPX moves +10 points
ES will usually move approximately +10 points as well.
But ES is an actual tradable futures contract.
For one ES contract:
1 point = $50
So:
10-point move × $50 = $500
For the smaller MES — Micro E-mini S&P 500:
1 point = $5
So a 10-point move is:
10 × $5 = $50
Why aren't SPX and ES exactly the same price?
This is one of the most important differences.
You might see:
SPX: 6,700
ES: 6,730
and wonder why ES is 30 points higher.
That's normal.
ES is a futures price, so it incorporates things such as:
interest rates − expected dividends + time until expiration
This creates what's often called the futures premium / discount or fair value difference.
As the futures contract gets closer to expiration, ES and SPX generally converge.
So you shouldn't expect:
ES price = SPX price
But their movement is highly correlated.
What is the RTH gap?
The RTH (Regular Trading Hours) gap maps the prior session’s closing reference against today’s 9:30 AM opening print. In my setup, I use a 4:08 PM chart reference rather than the standard 4:00 PM regular-session close. All times here are New York time (America/New_York). Use the same chart reference consistently; 4:08 PM is my strategy setting, not the official stock-market closing time.
Anatomy of the gap
Two reference points define the gap. Everything else — the 25%, 50%, 62% and 70.5% retracement levels — is measured inside this range.
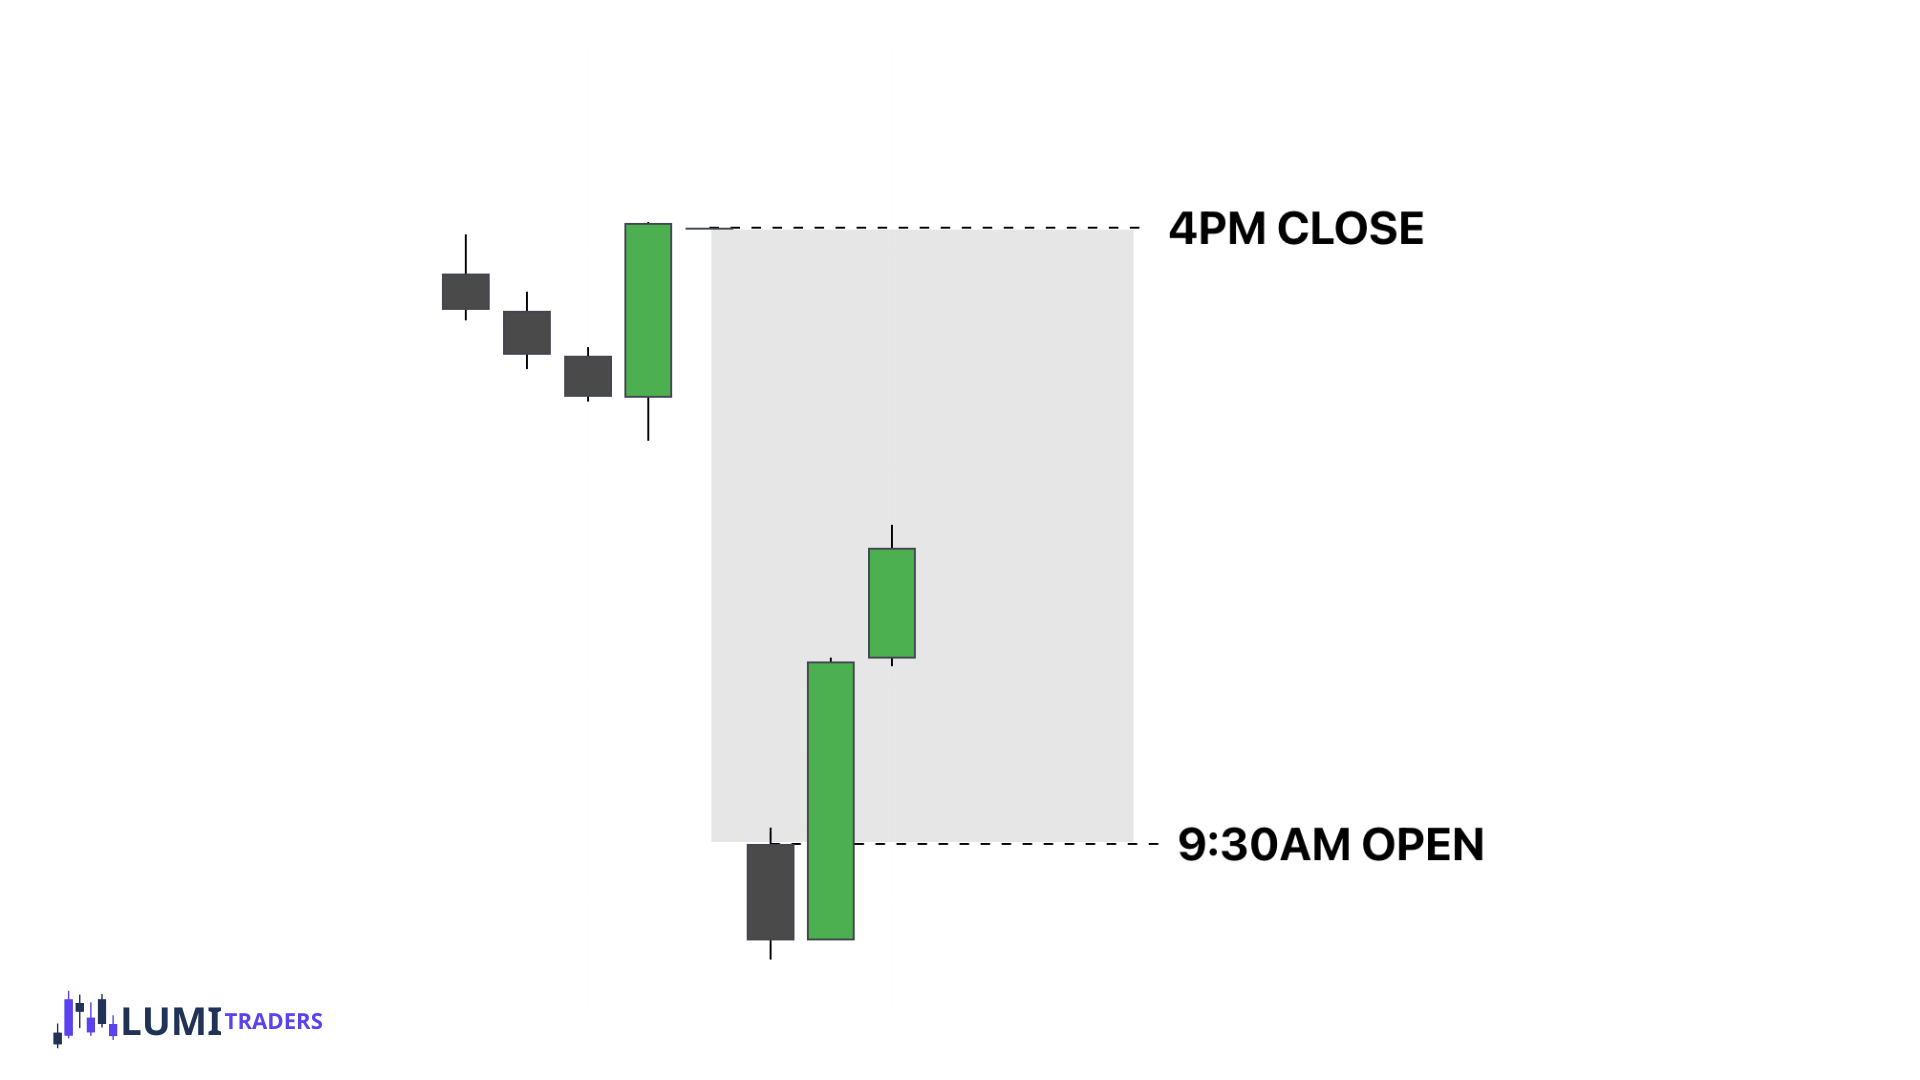
4:08 PM chart reference
My selected prior-session reference forms one boundary of the gap. It is distinct from the standard 4:00 PM regular-session close.
9:30 AM open
Today's regular-session opening print. The other boundary — the gap is everything in between.
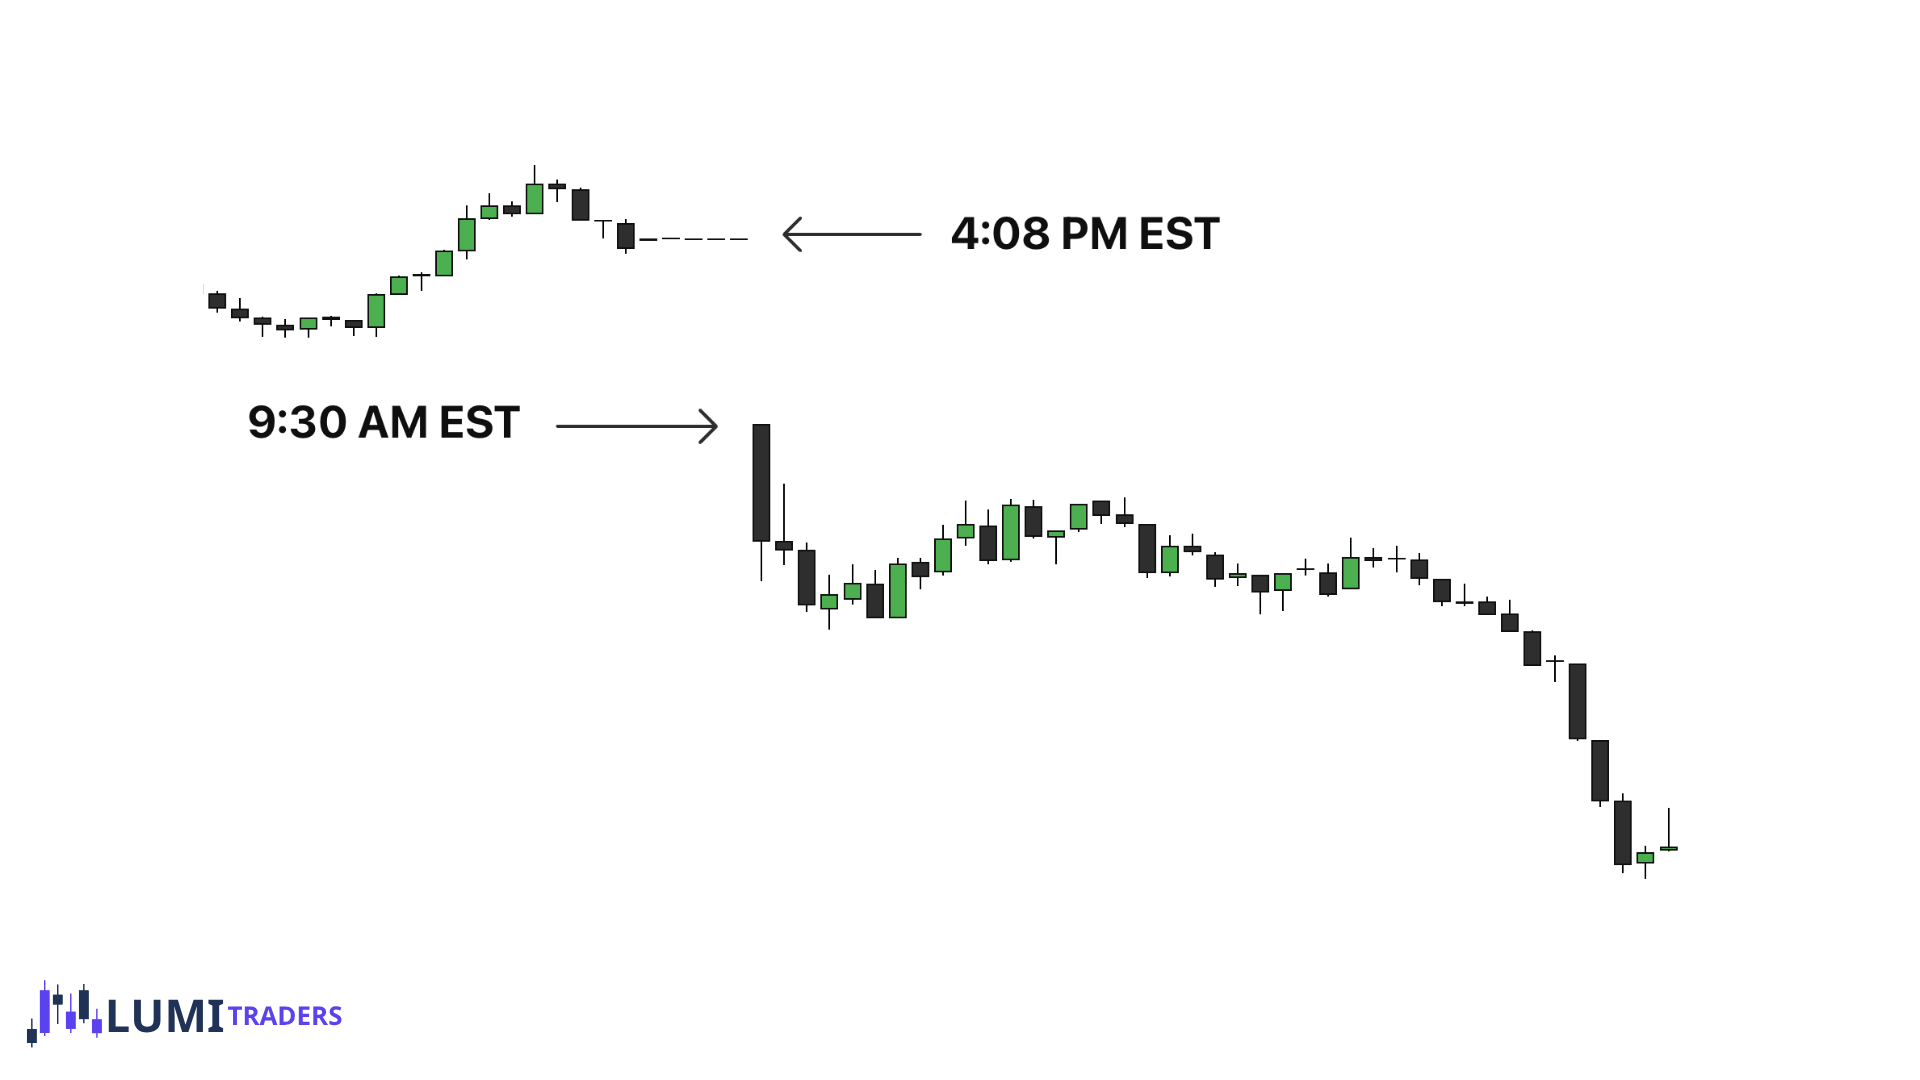
The gap represents unbalanced price delivery. It doesn't need to fill immediately — price may only partially fill it while balancing everything that happened overnight.
The gap as a map of the open
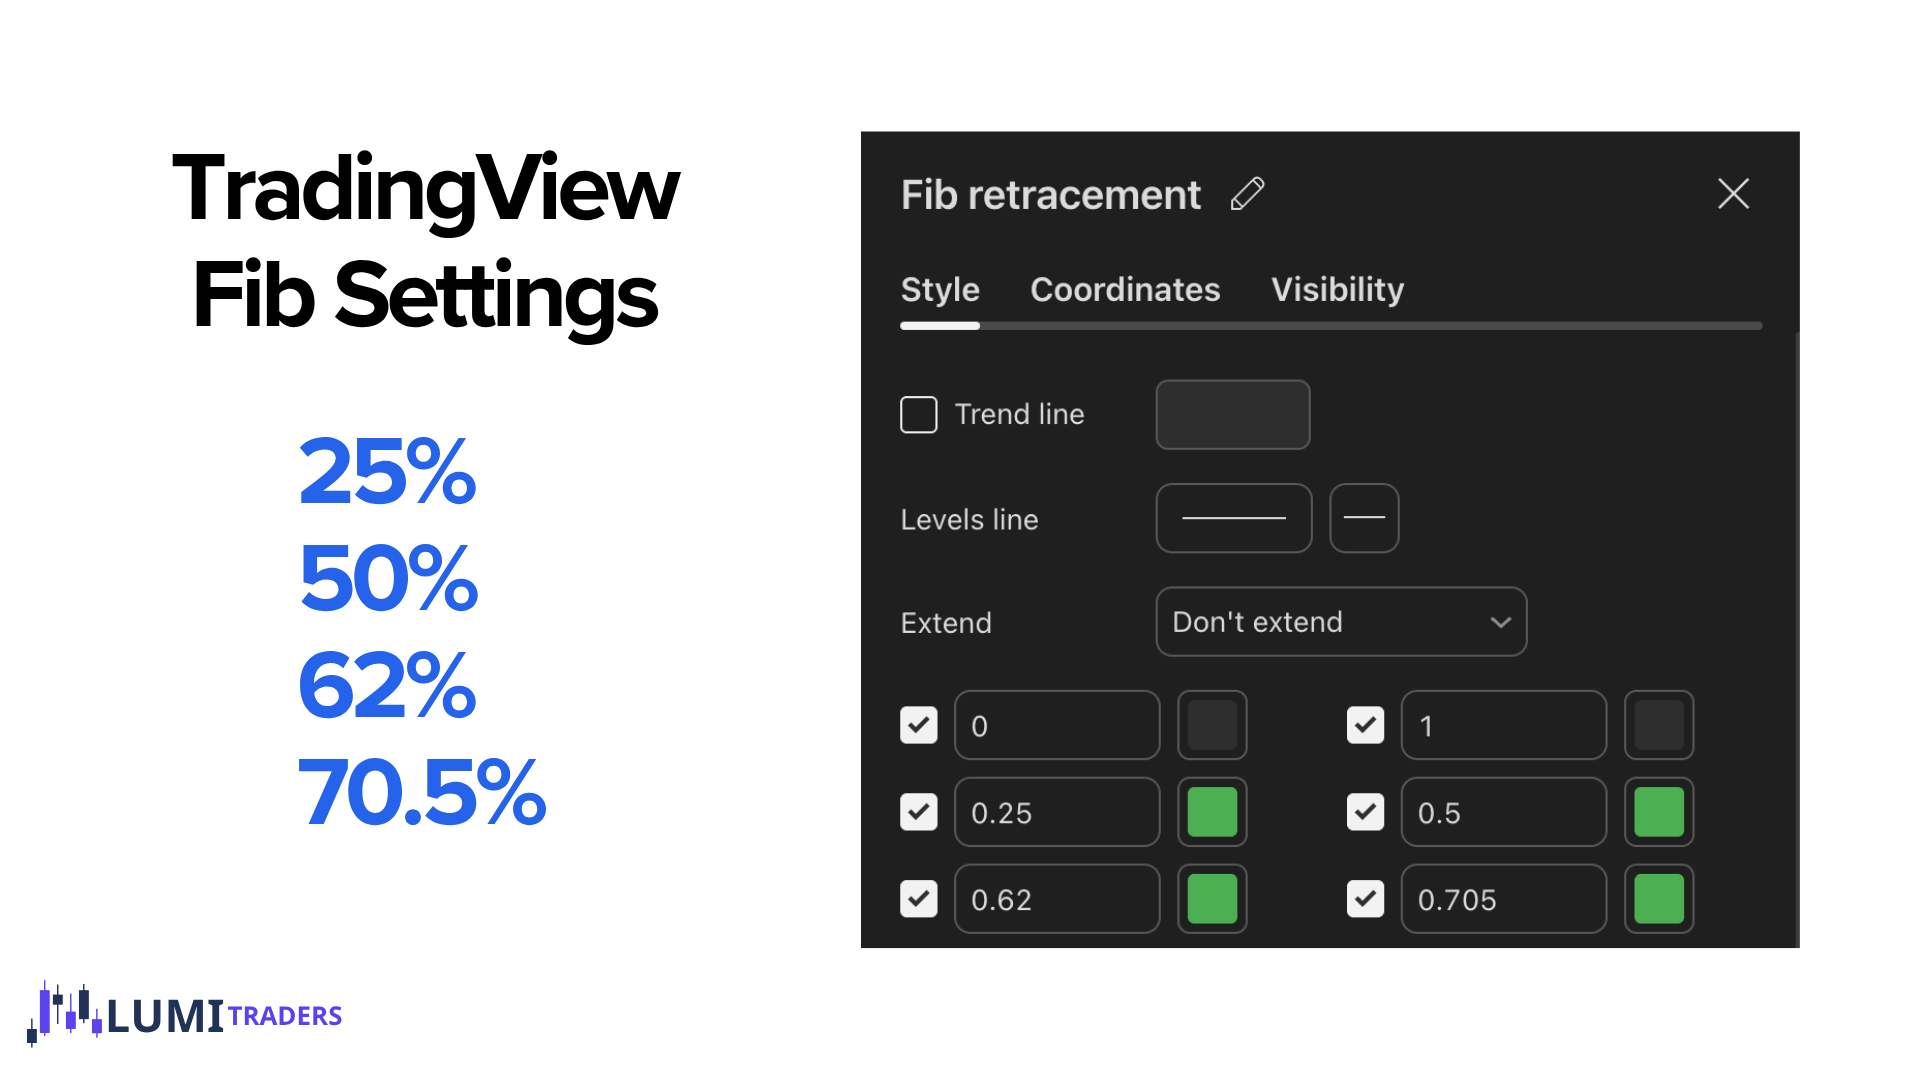
Once the open prints, drop a fib from one boundary of the gap to the other. The 0.25, 0.5, 0.62 and 0.705 levels become the reference zones for the entire morning session.
4 scenarios to know
Shallow retracement (25–50%)
SPX opens near liquidity but fails to take it in the first 30 minutes.
OTE retracement (62–70.5%)
SPX takes the nearest liquidity level in the first 30 minutes, then retraces deep.
Break of 70.5% full fill
Price drives straight through the OTE — continuation toward a complete gap fill.
Overlap Gap
SPX opens inside an old unfilled RTH gap, creating a new RTH gap within the old one.
Shallow retracement · 25–50%
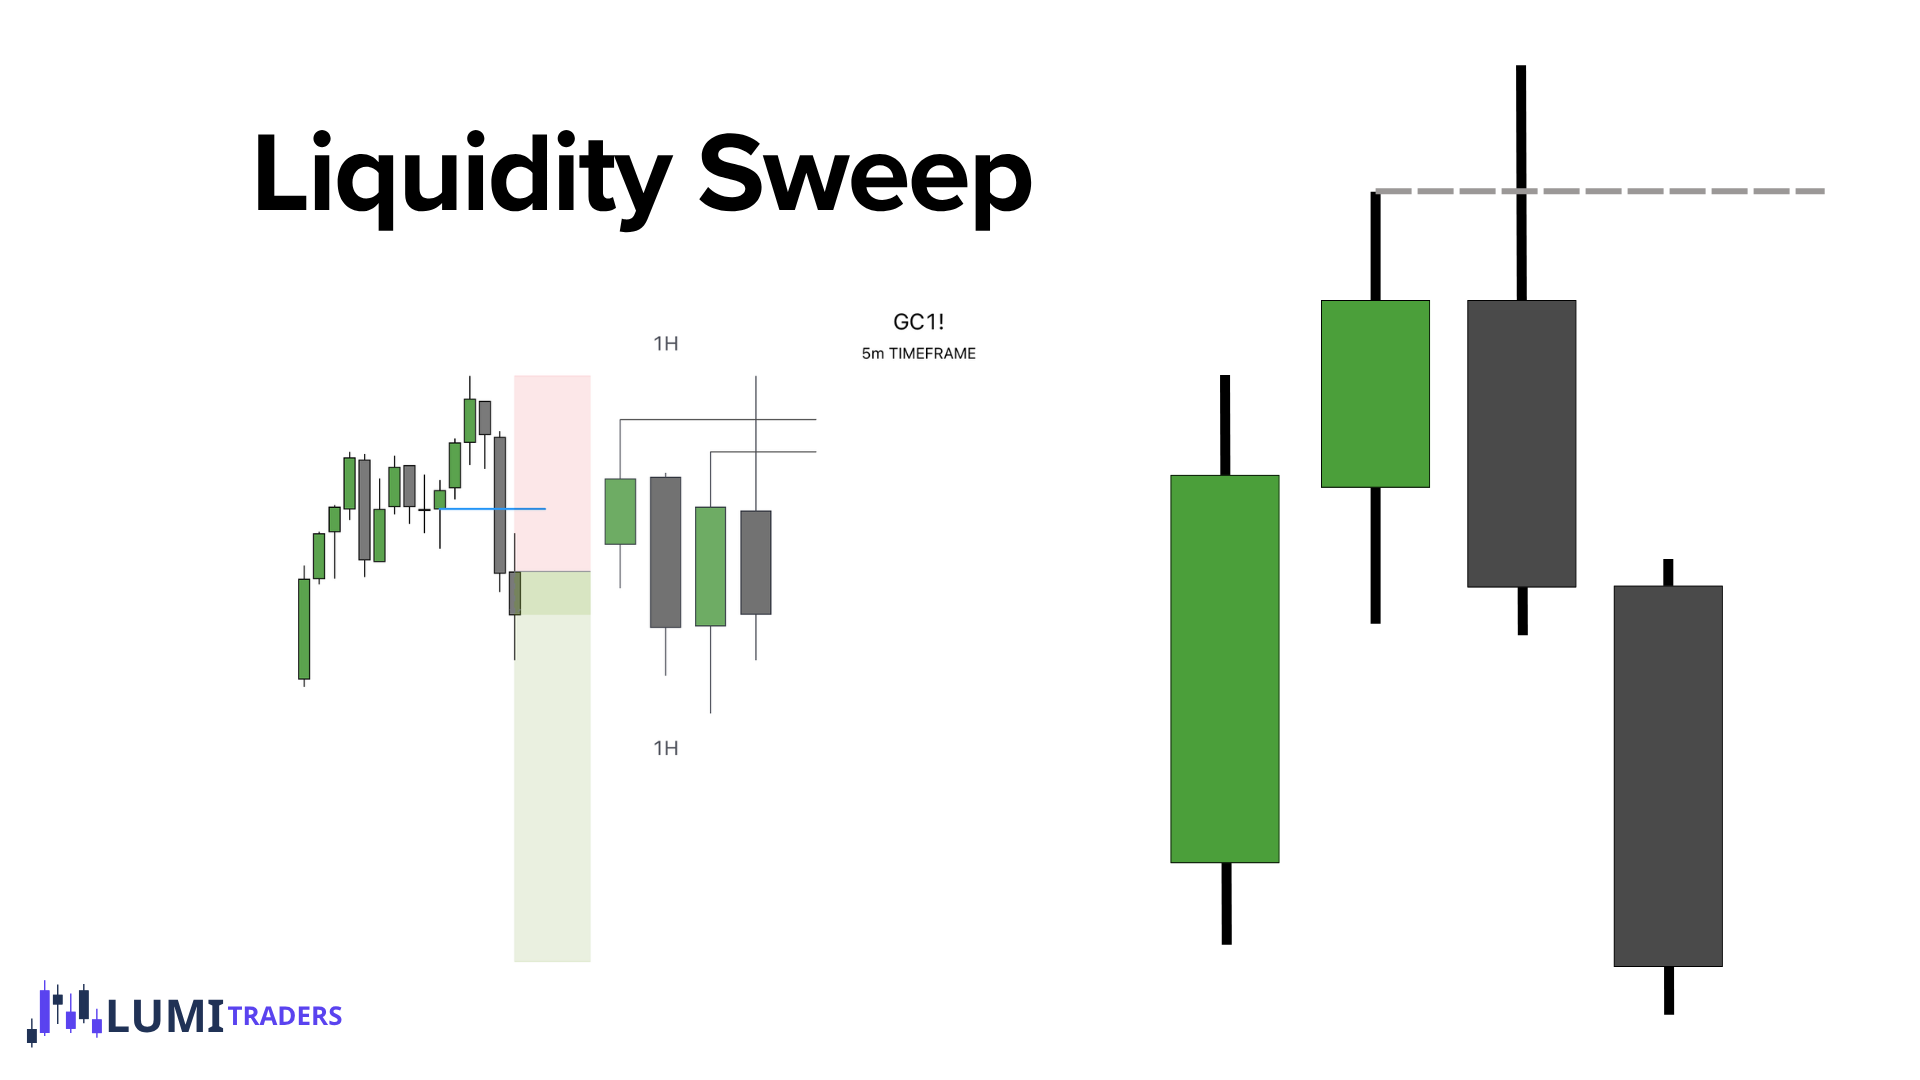
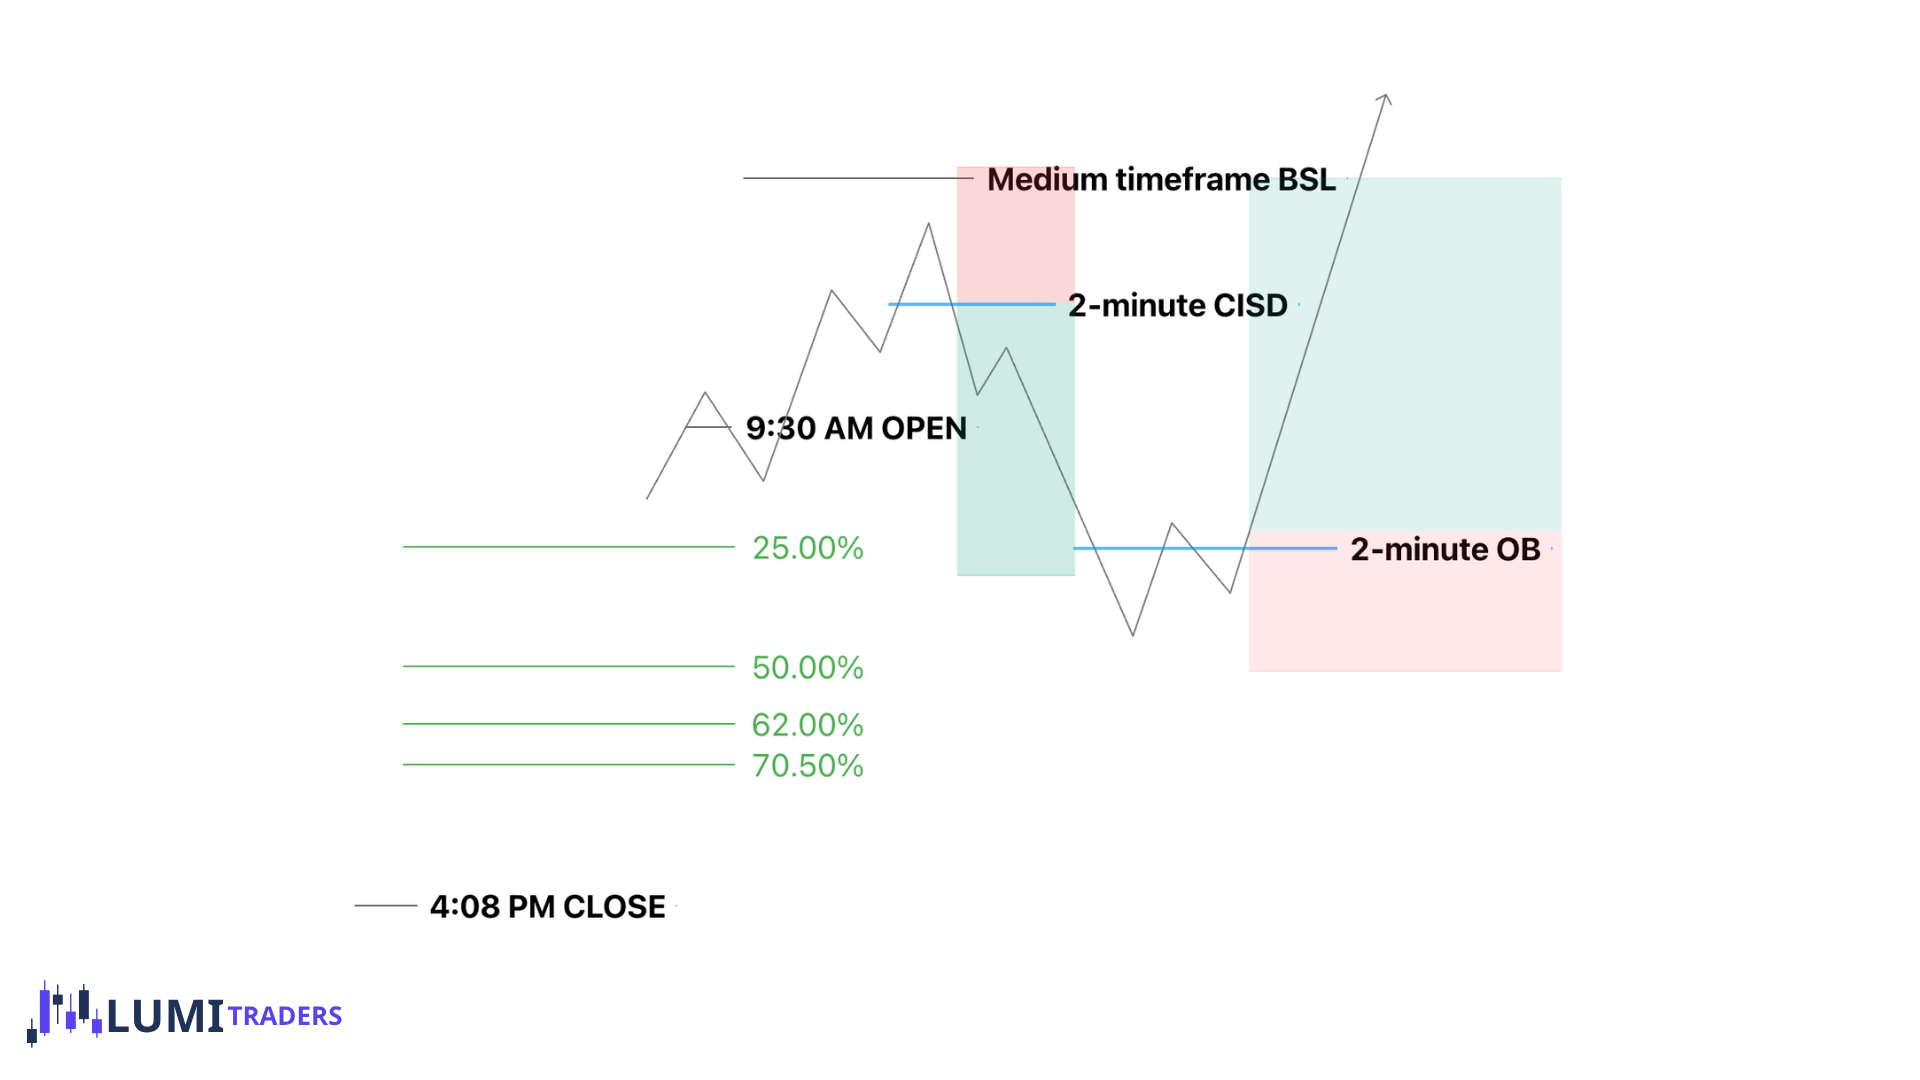
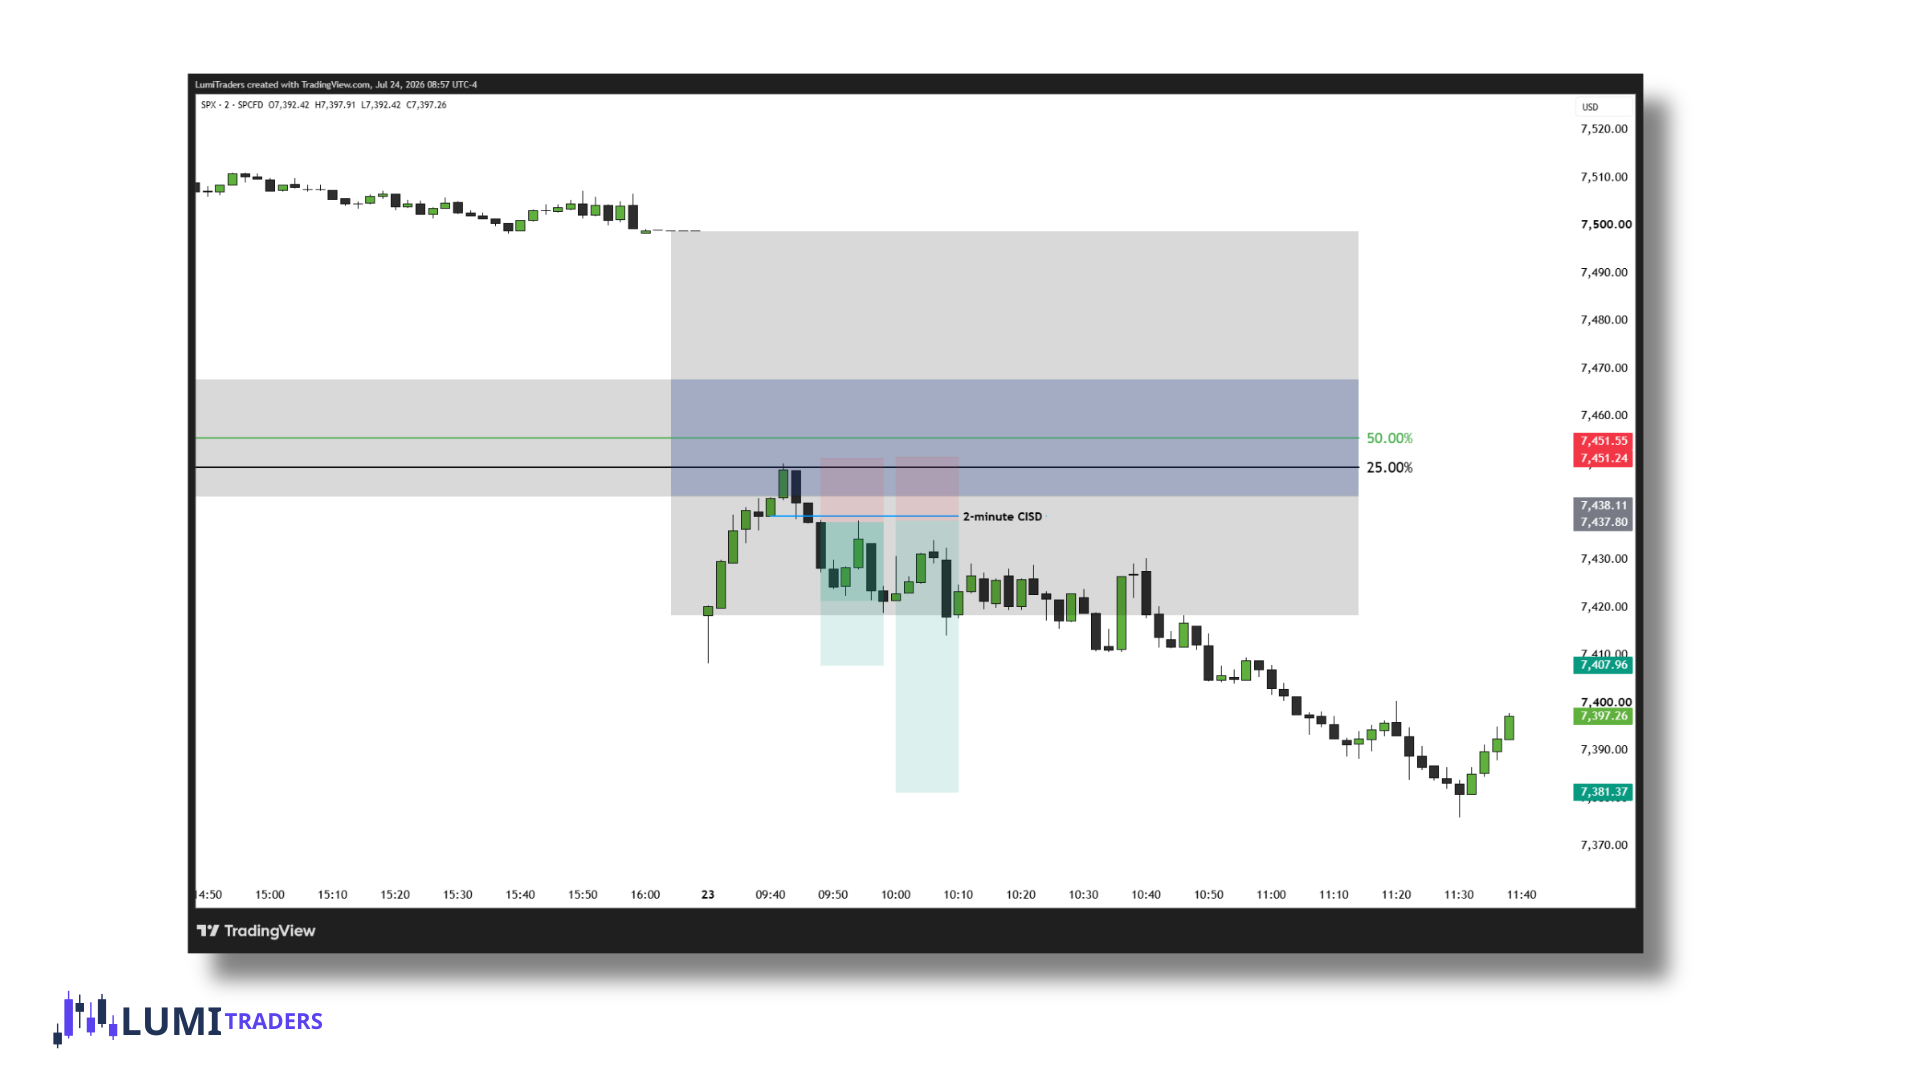
A shallow retracement — typically into the 25%–50% zone — occurs when the market doesn't require a deeper correction. This often happens when SPX opens near a liquidity level but fails to take it during the first 30 minutes after the open.
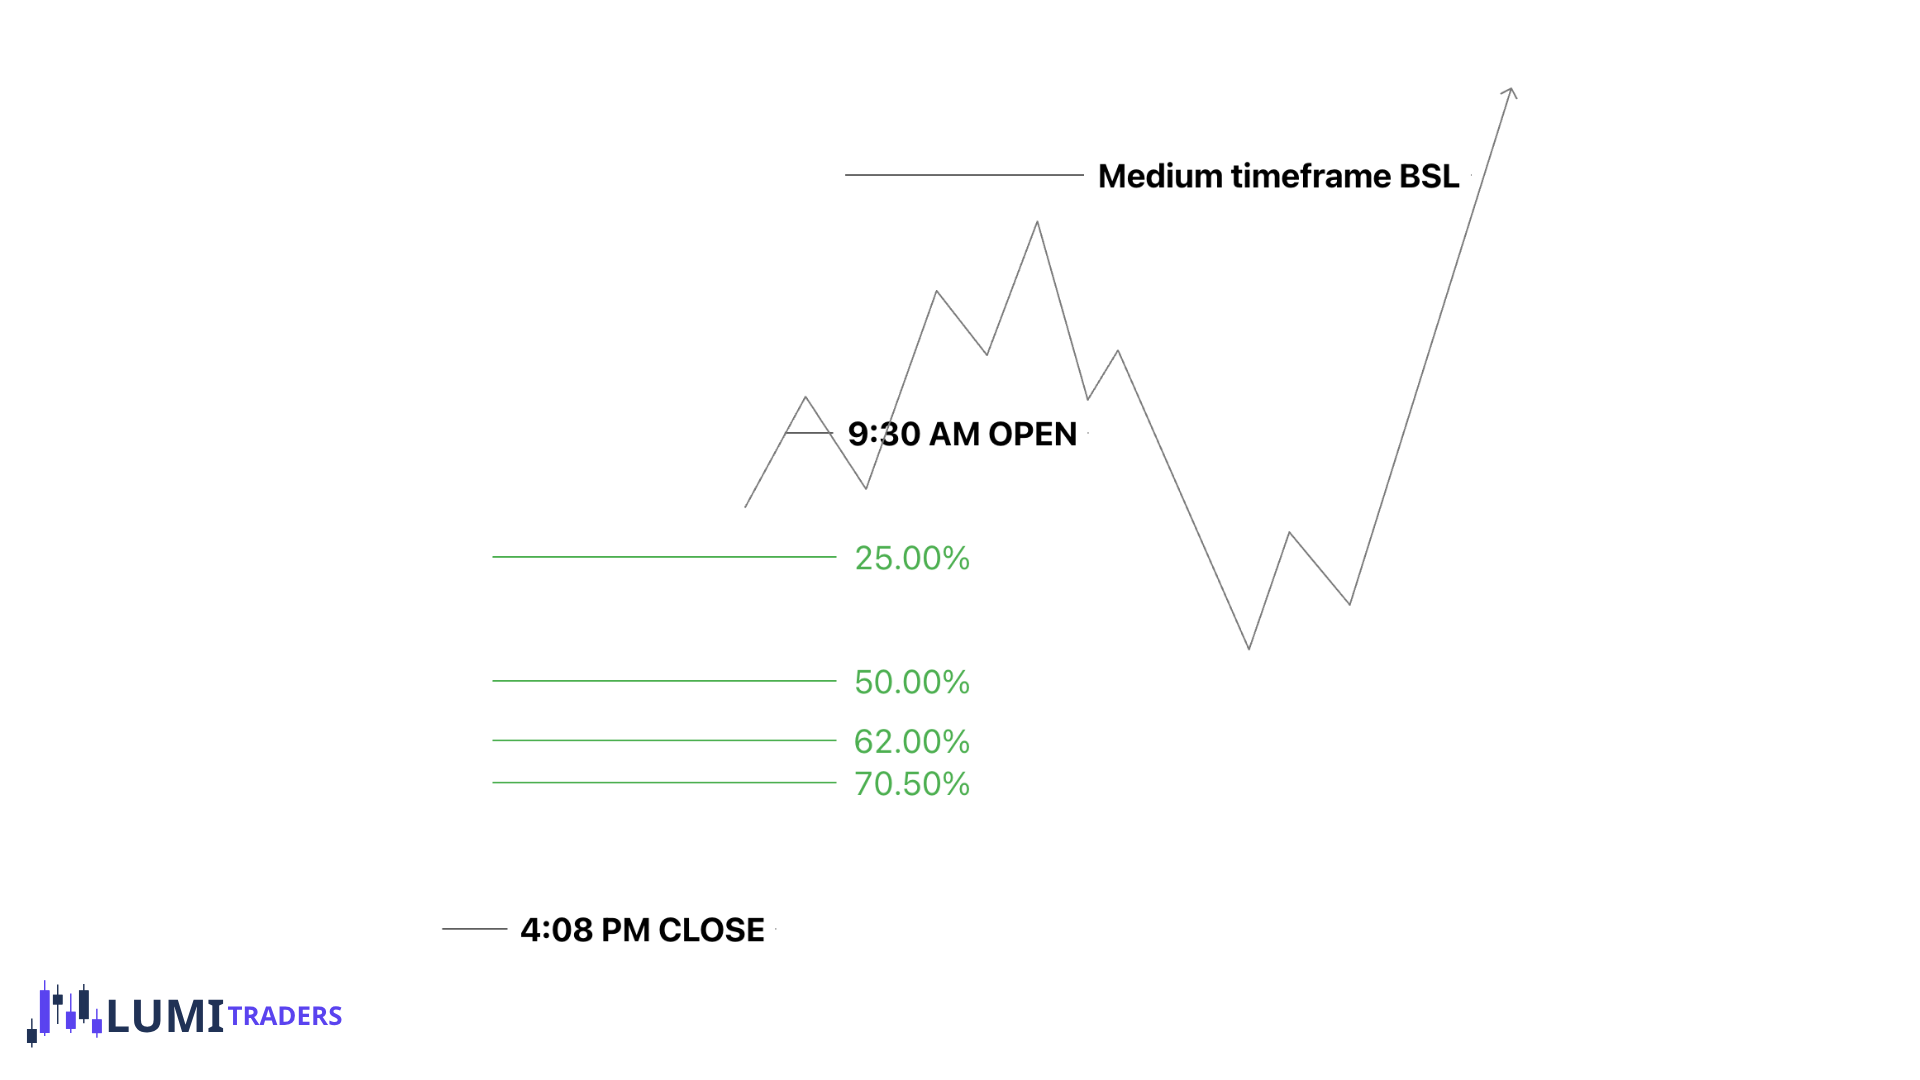
Liquidity that we want to observe must be on MTF and HTF.
MTF: 15-minute and 30-minute
HTF: 1-hour and higher
This is where I anticipate a shallow retracement followed by continuation toward the original liquidity objective.
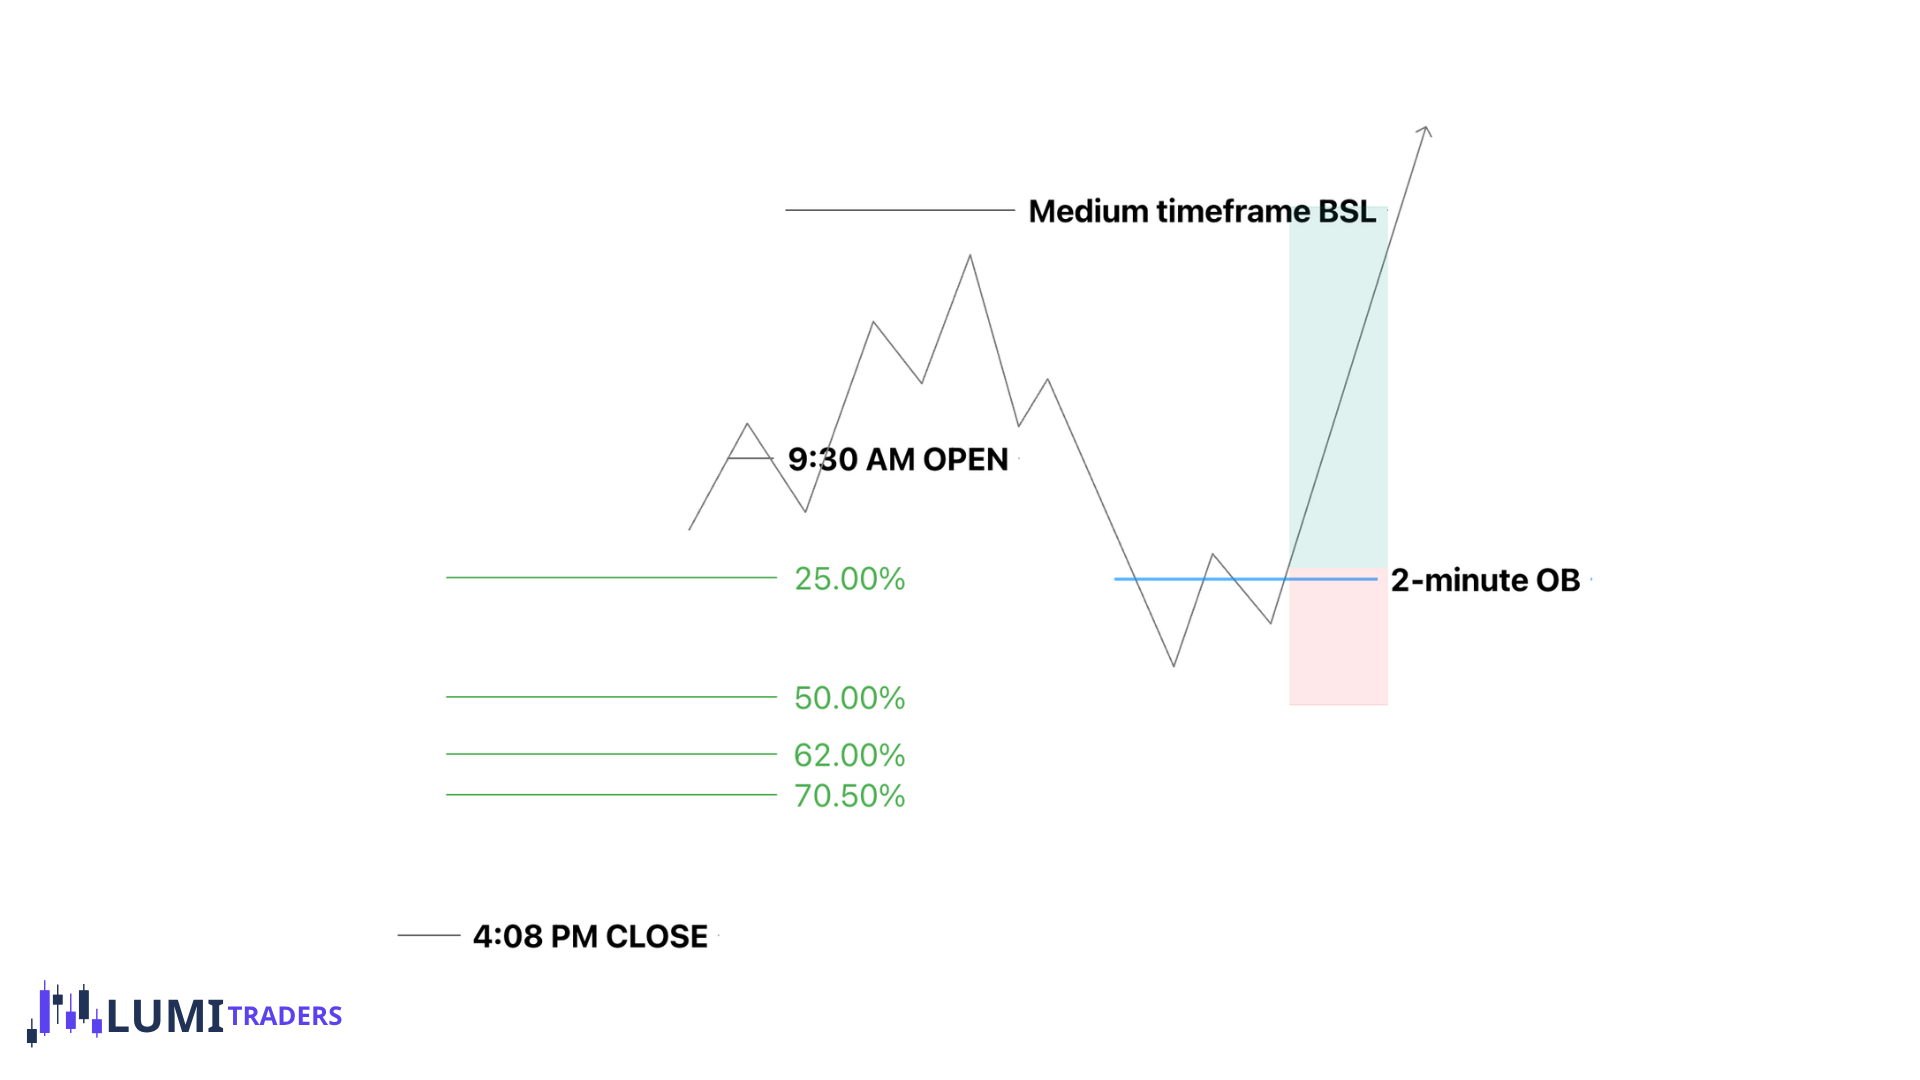
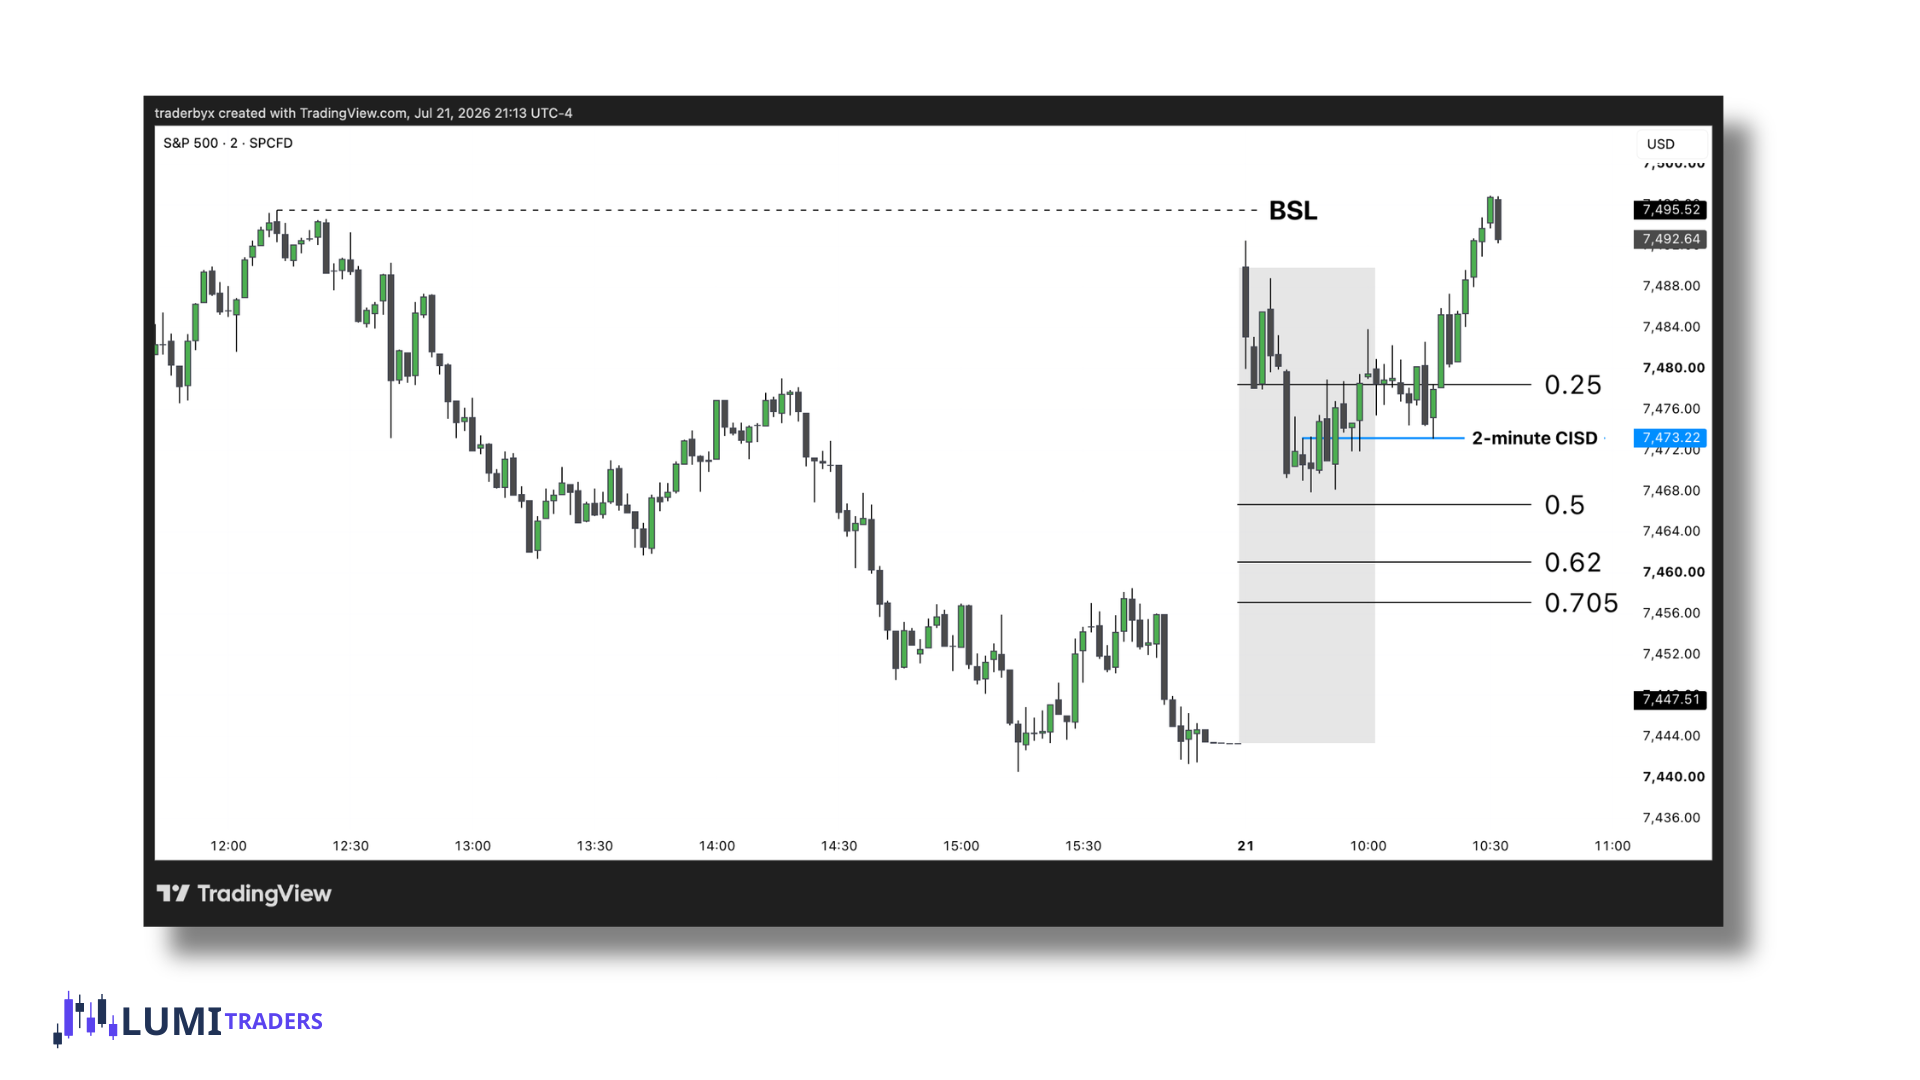
Reaction from 25% doesn't need perfection — the CISD is what turns the level into a trade.
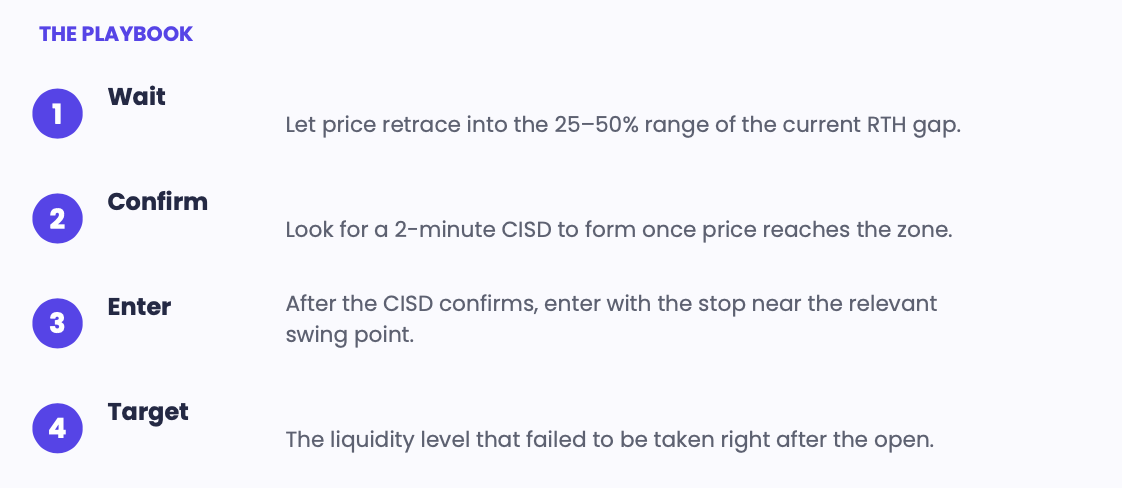
If SPX fails to take an MTF/HTF liquidity level within the first 30 minutes after the market opens, we can look for a 2-minute CISD confirmation to enter a trade, targeting the 25–50% retracement levels of the current RTH gap.
OTE retracement · 62–70.5%
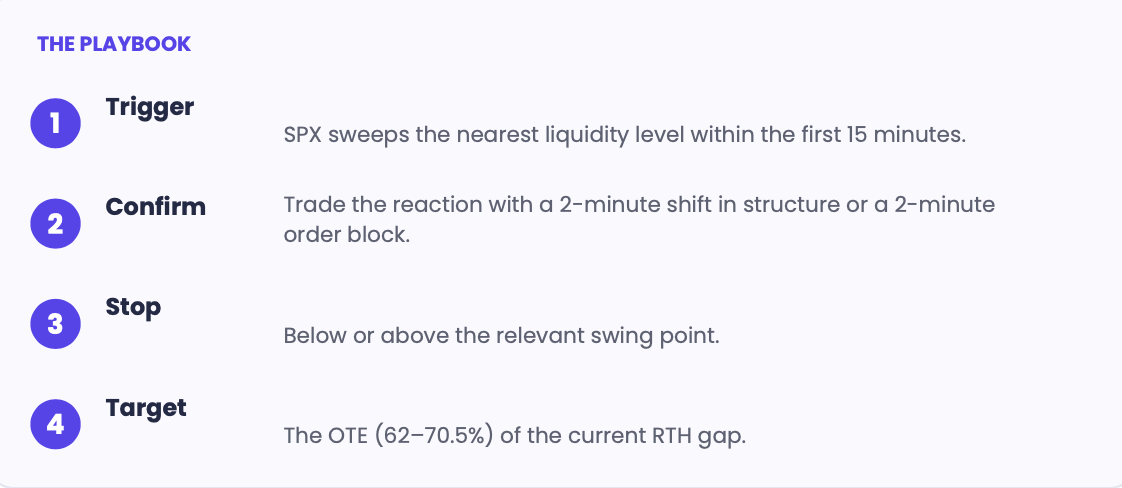
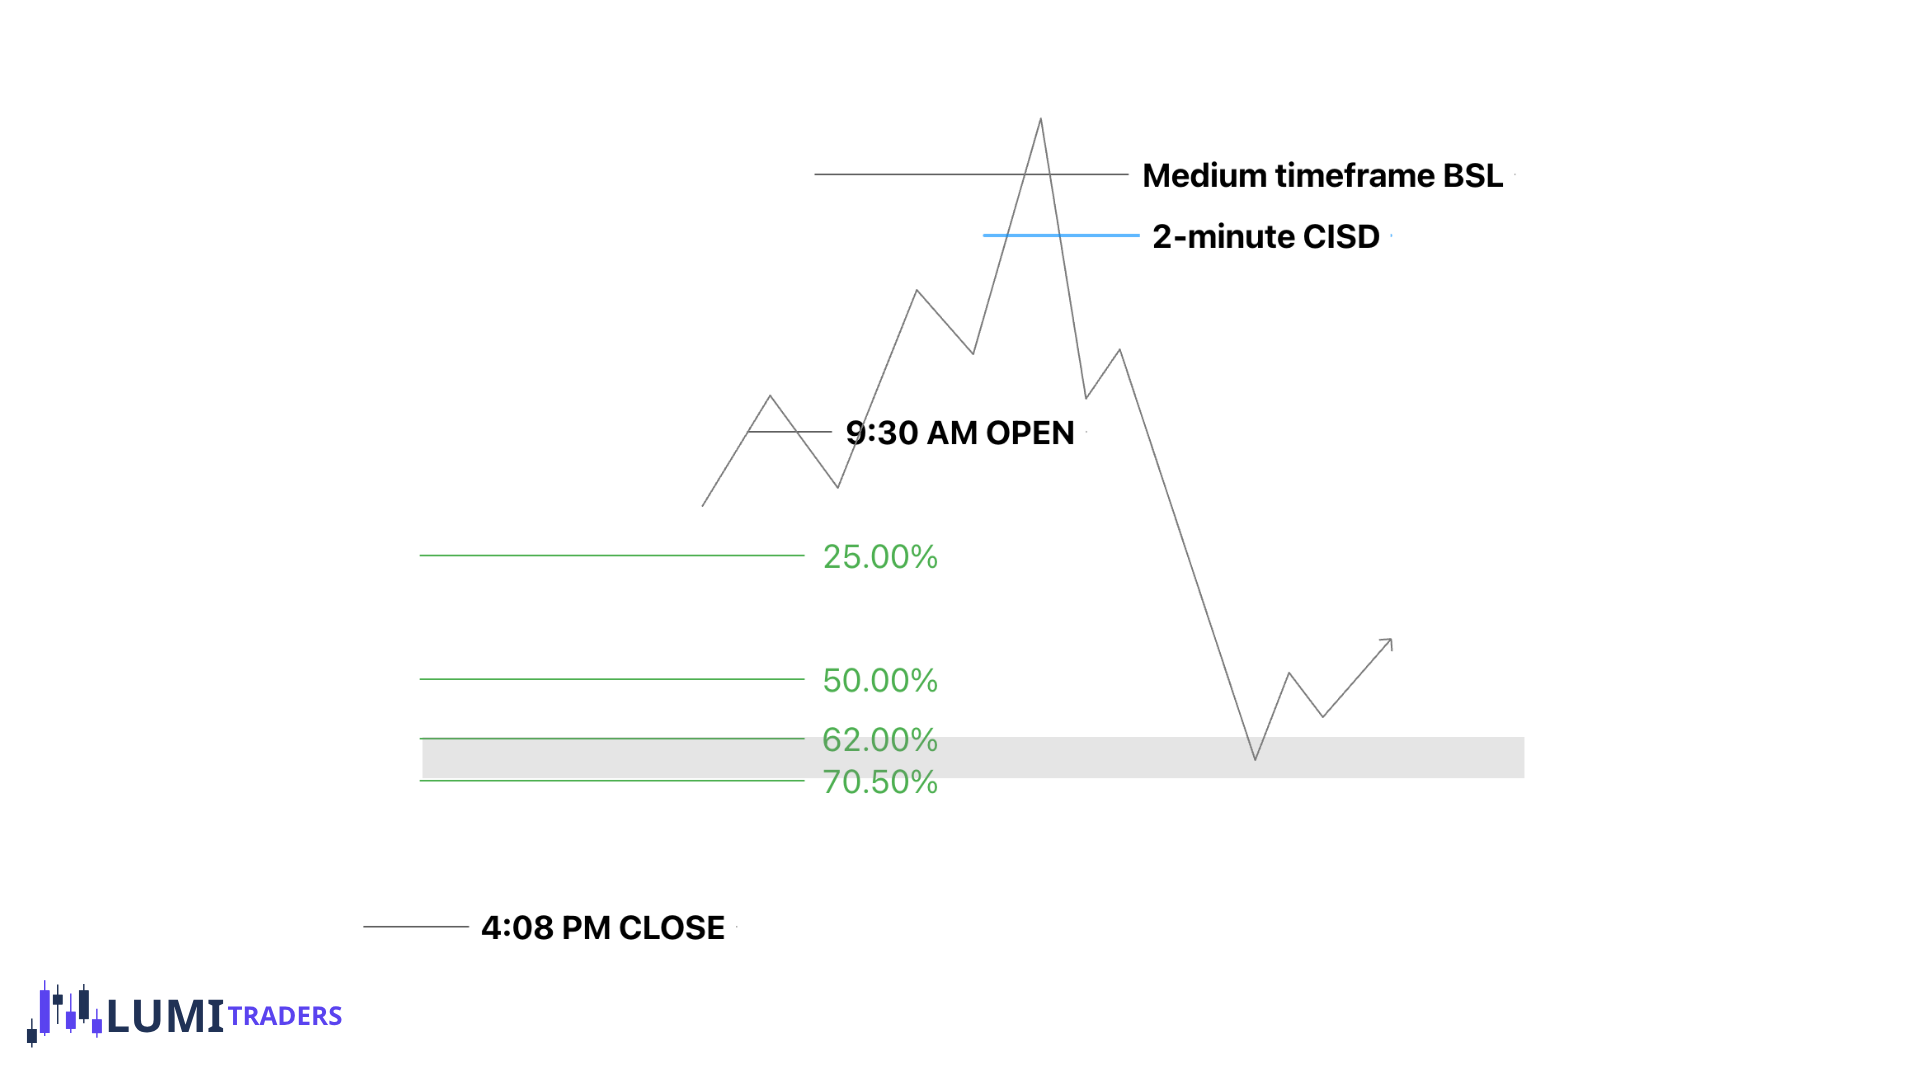
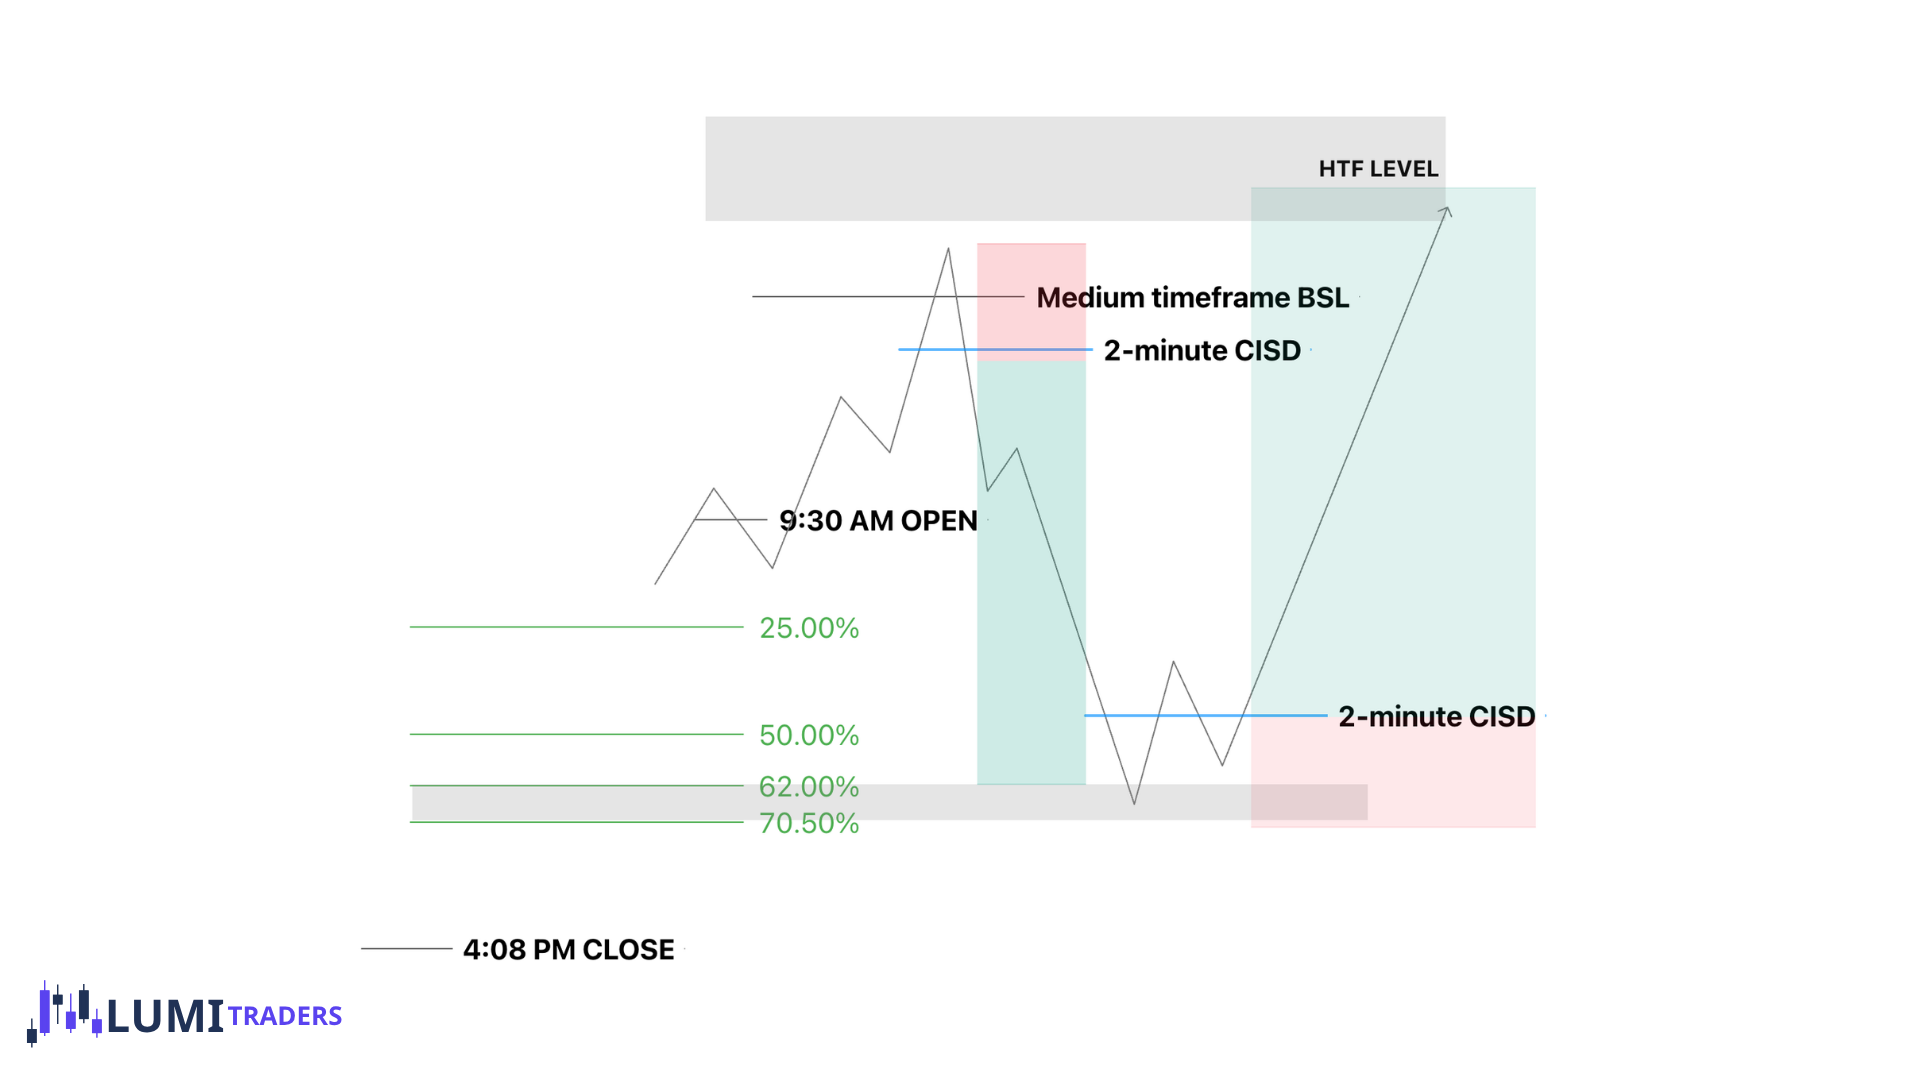
A retracement into the OTE of the RTH gap — between 62% and 70.5% — often occurs when SPX takes the nearest liquidity level during the first 30 minutes after the open.
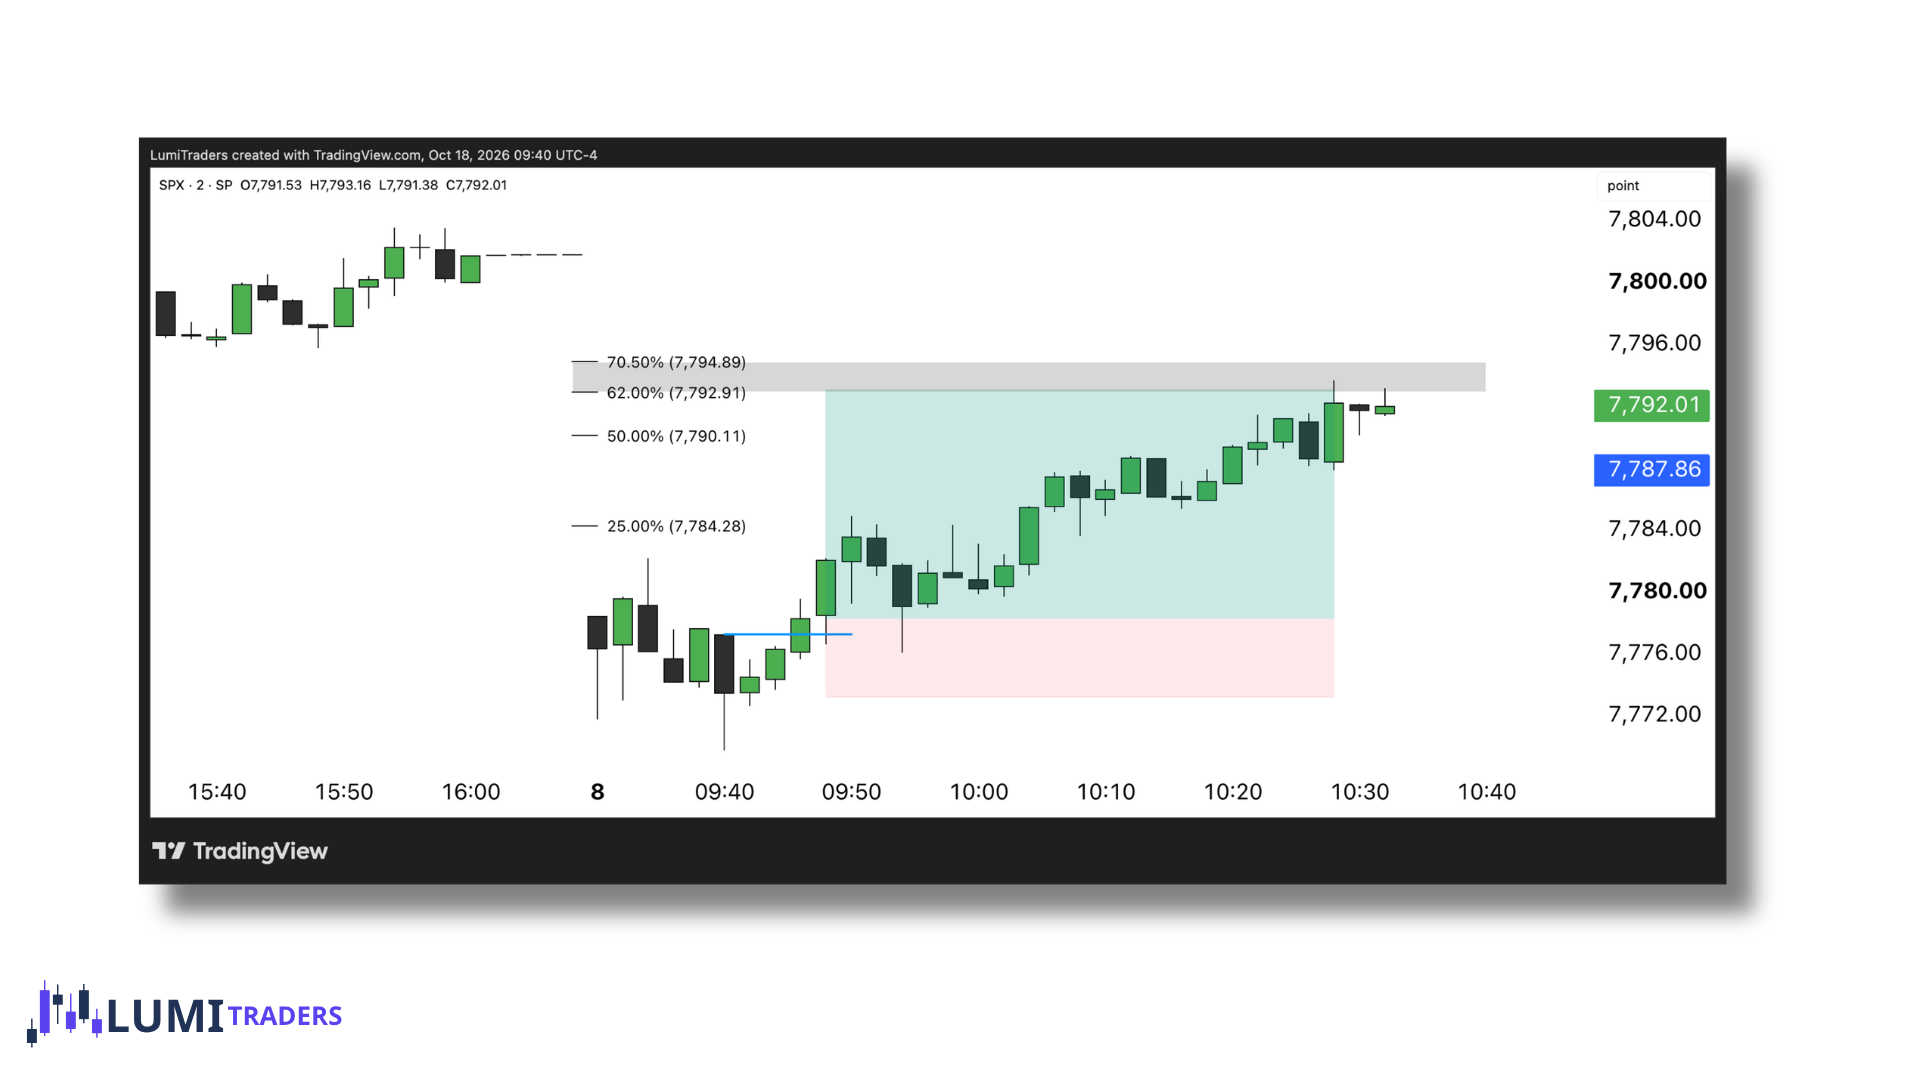
What happens next?
If SPX has already reached an important HTF level before retracing into the OTE, I usually don't expect a strong reaction from the OTE area. Price may completely fill the gap or consolidate within the OTE range.
However, if SPX takes the nearest liquidity level without reaching a significant HTF level, the OTE can become a potential reversal area — traded with the same confirmation, a 2-minute CISD.
This scenario can offer two separate trades:
A reaction from the liquidity level toward the OTE of the RTH gap.
A reversal from the OTE toward the important higher-timeframe level.
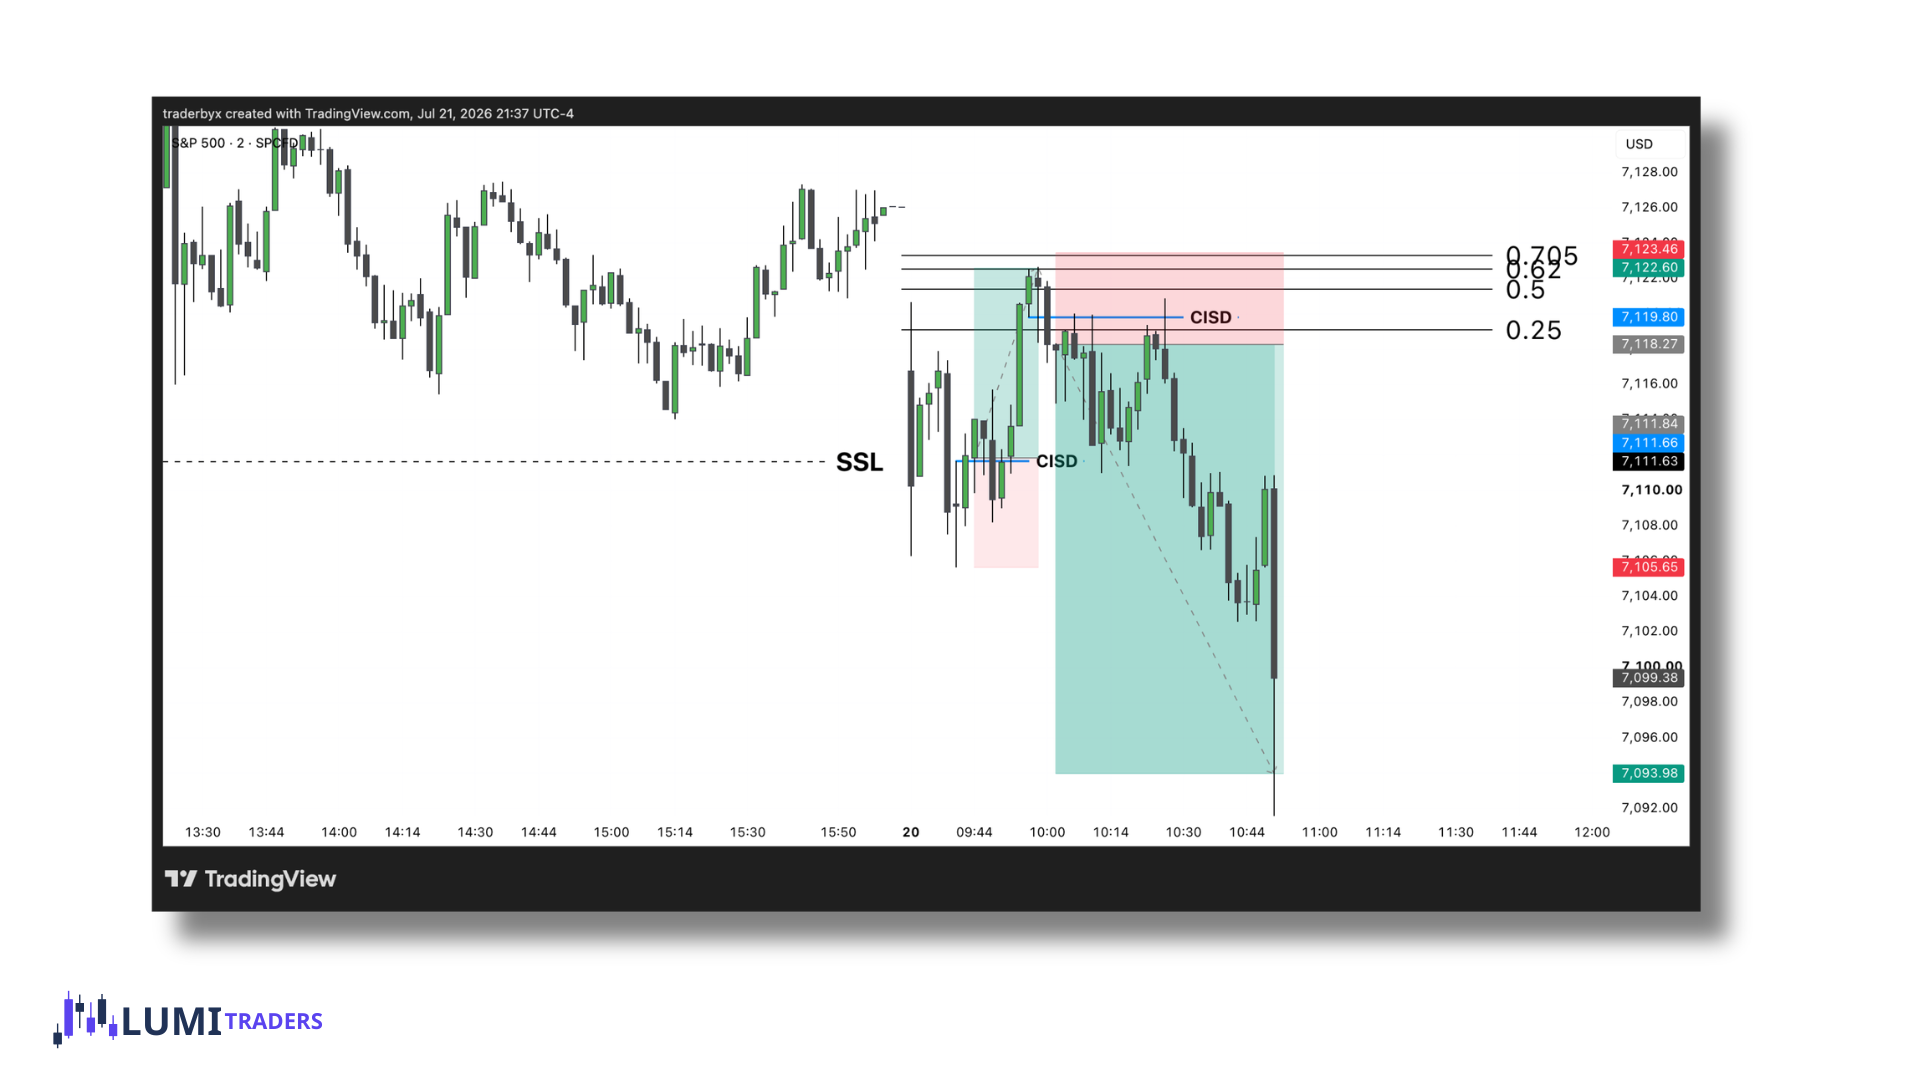
OTE to OTE
If SPX opens and trades directly into an untested 62%–70.5% OTE from a previous (old) RTH gap, treat that old OTE as a higher-timeframe level.
If price reacts from that level and confirms with a 2-minute CISD, we can look for a reversal trade targeting the 62%–70.5% OTE of the current RTH gap.
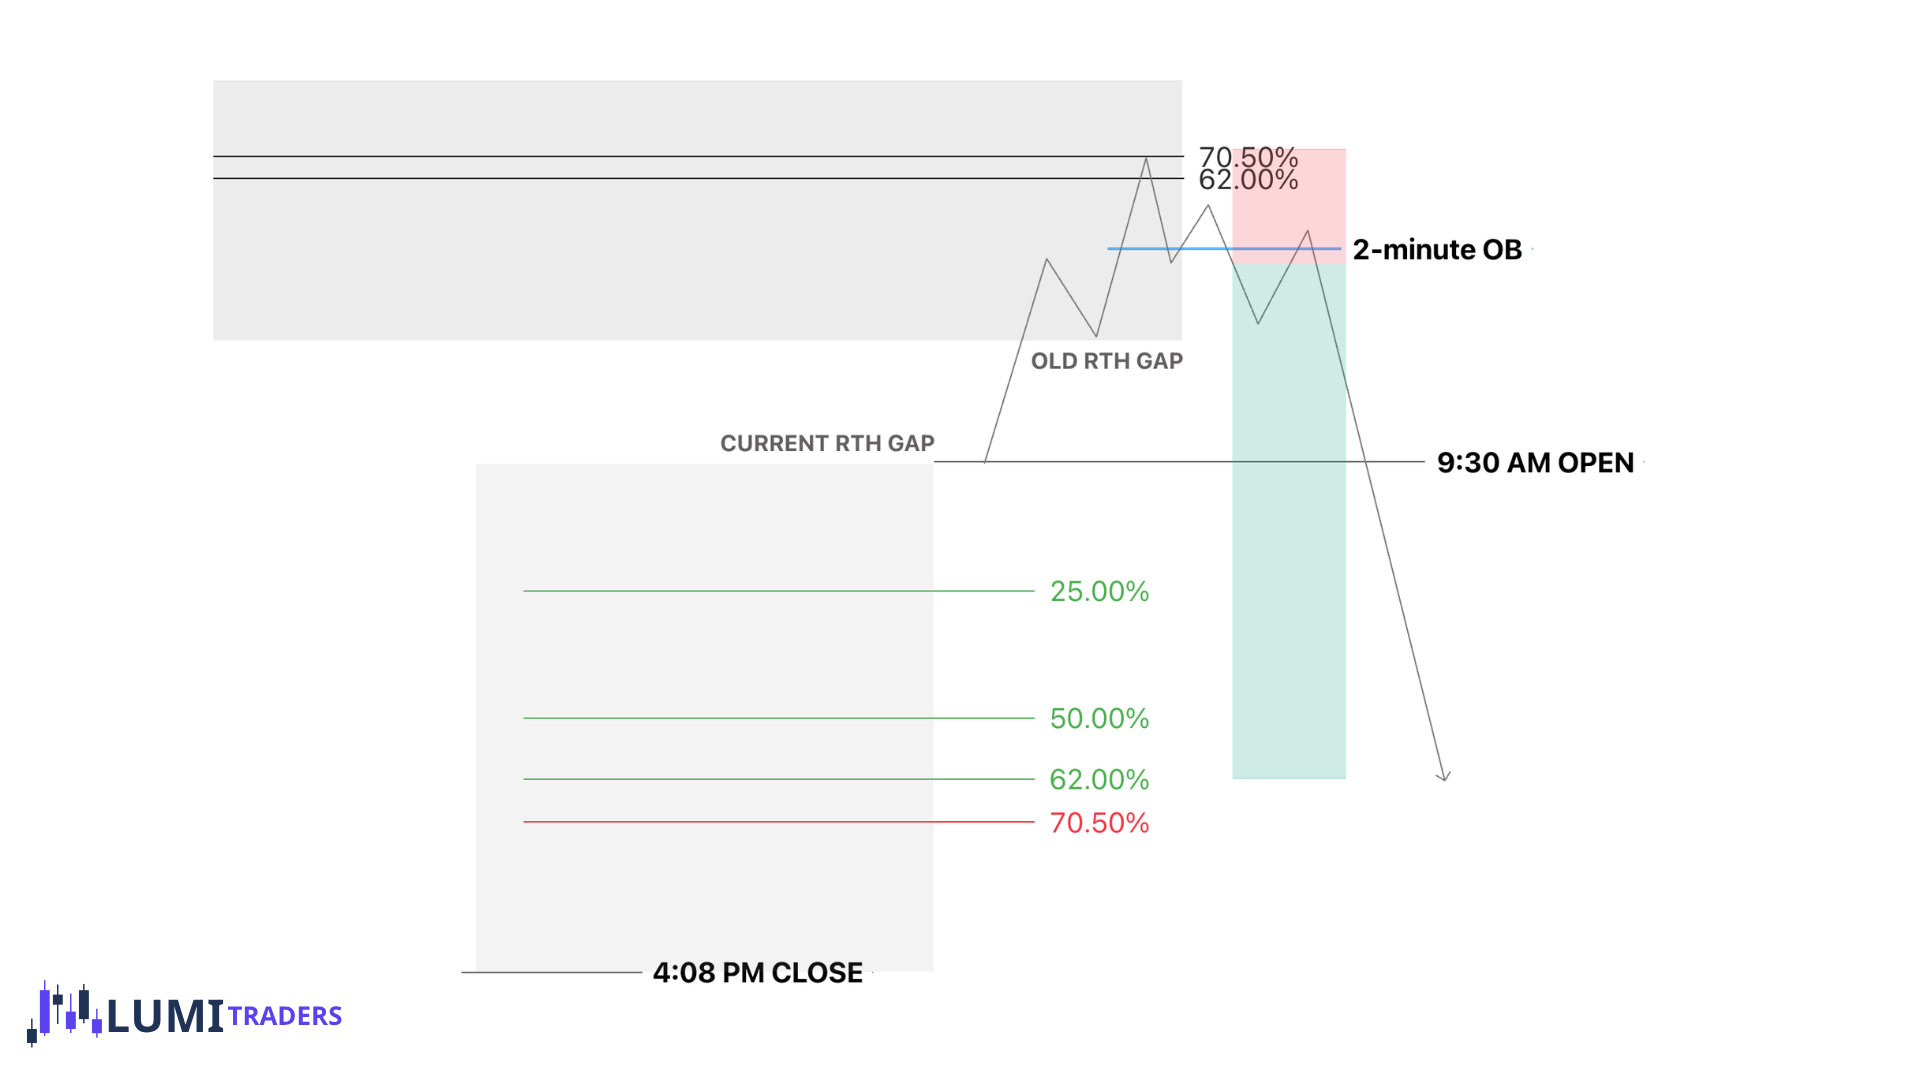
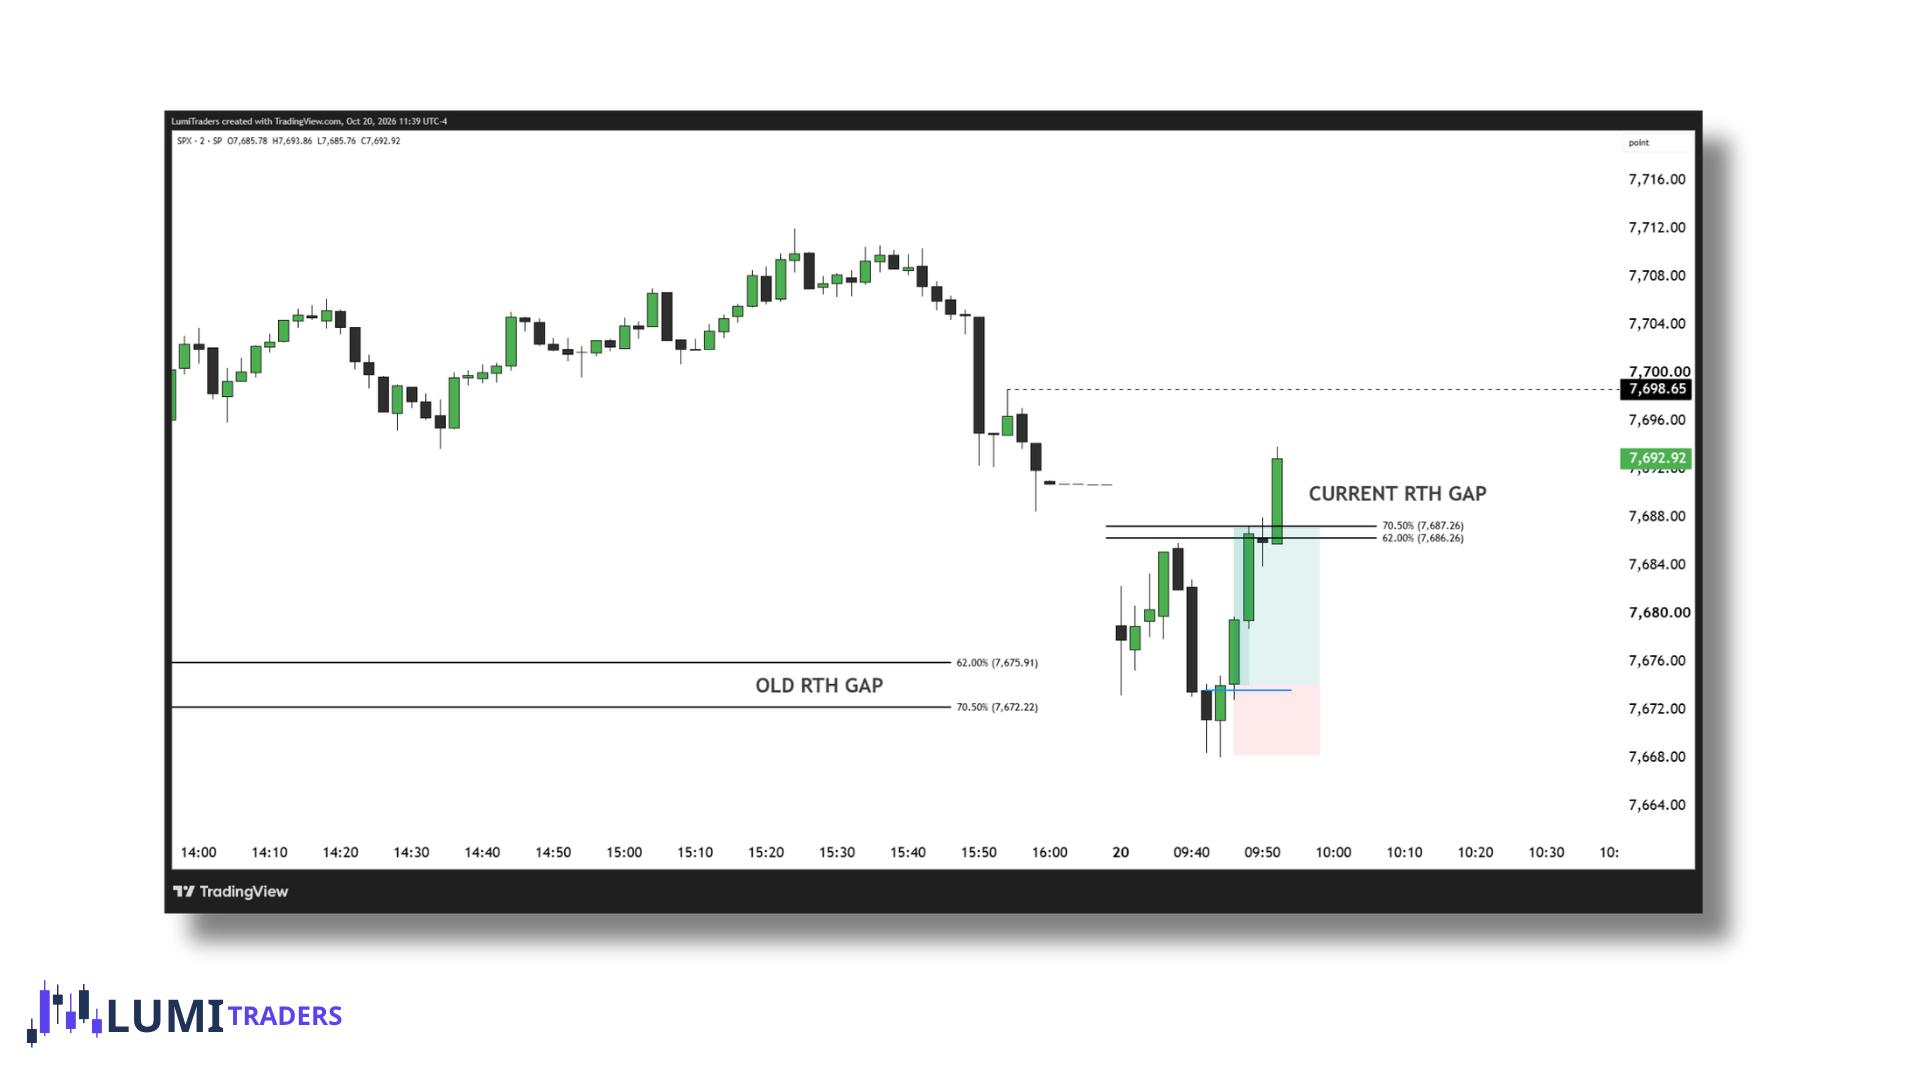
What to do with unfilled gaps
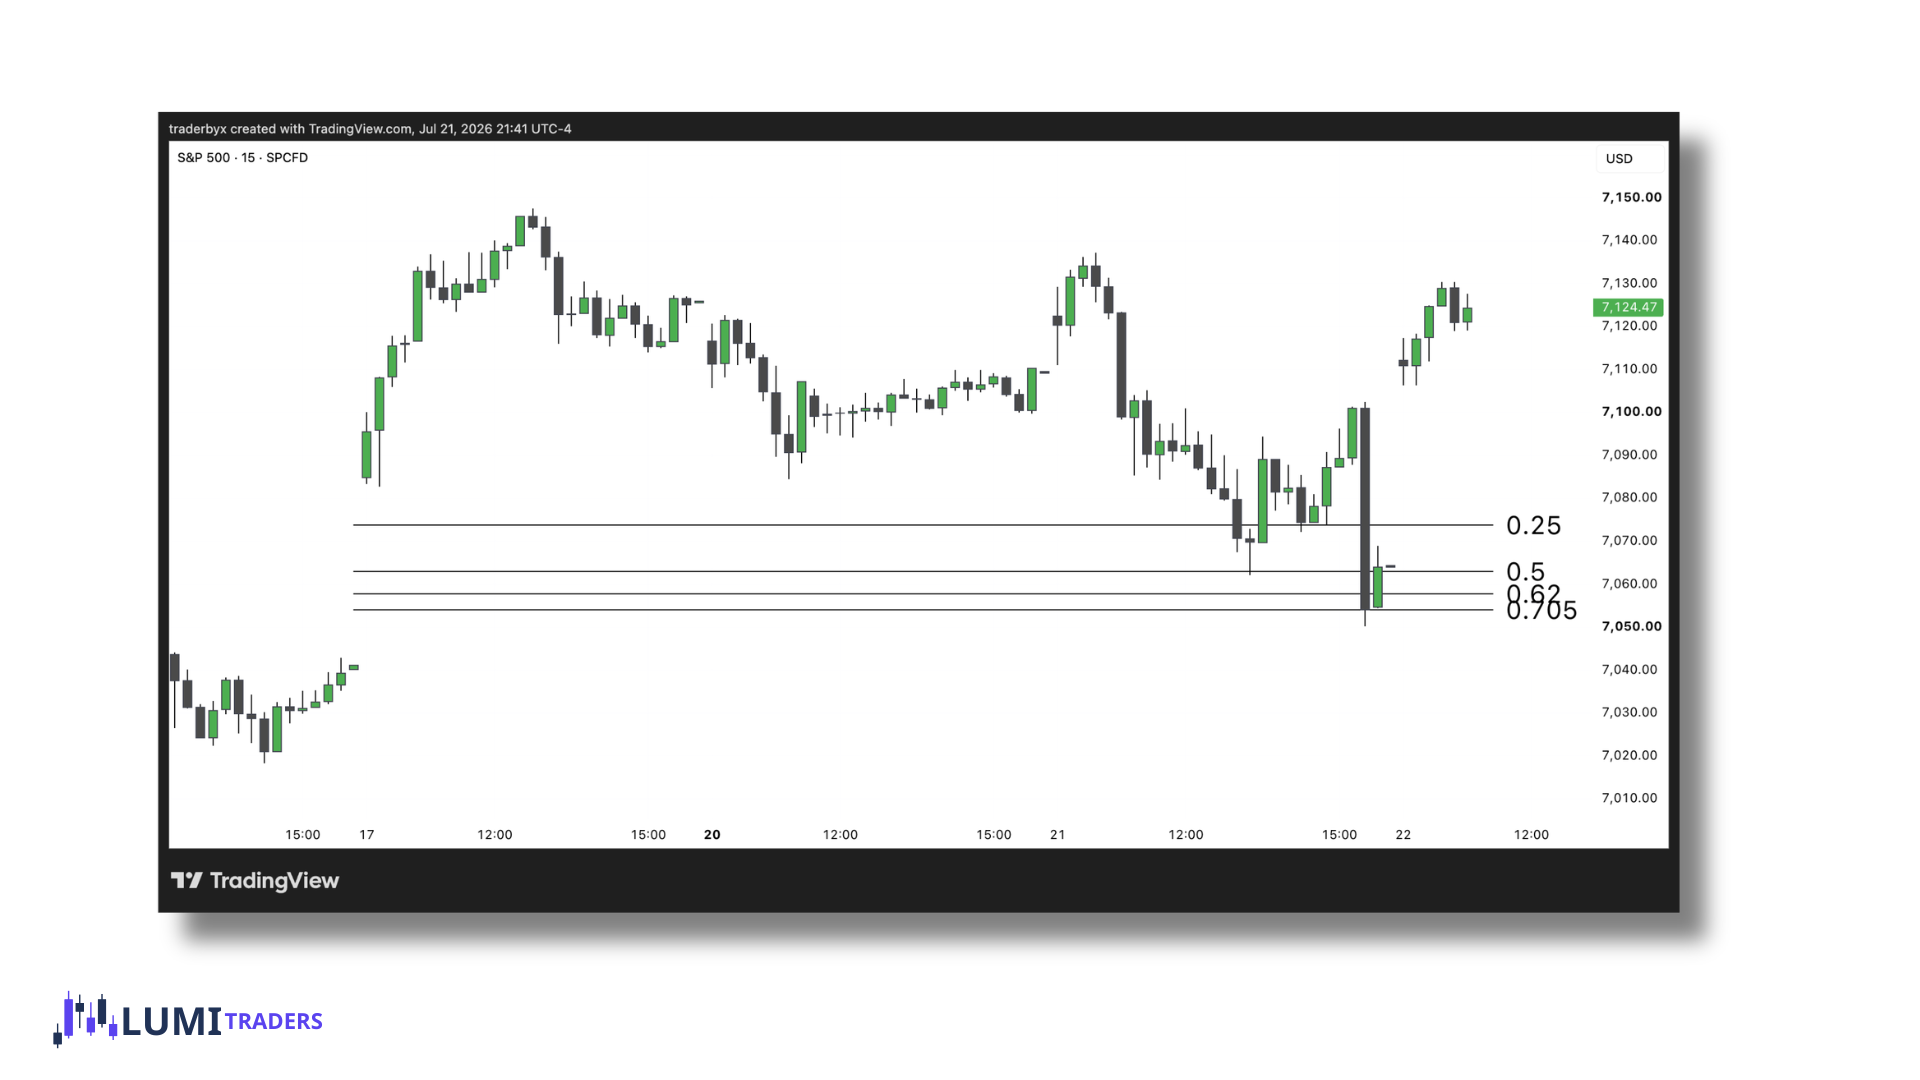
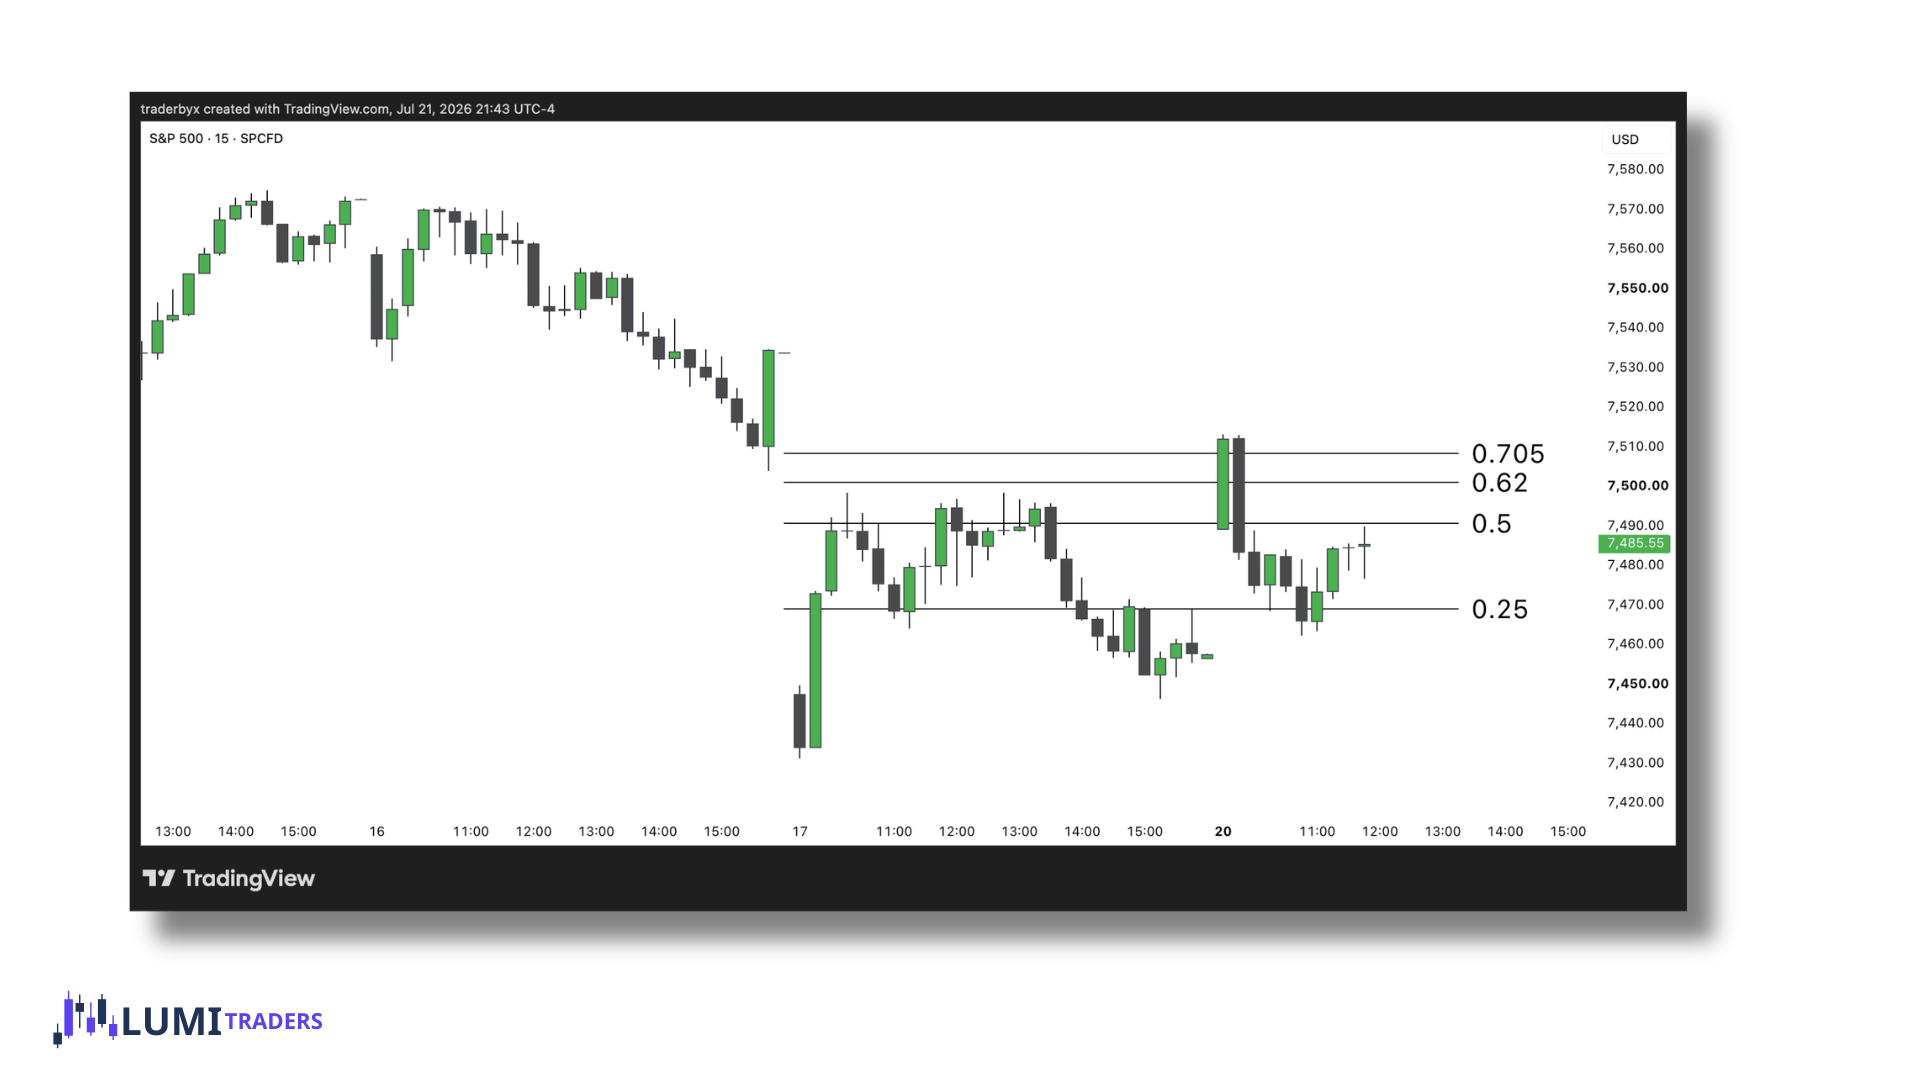
Sometimes SPX moves away from the gap without even reaching the 25% level. In other cases, price takes the nearest liquidity level but lacks the volume or time to reach the OTE before the session ends.
Keep them marked on your chart. These gaps can act as strong magnets for price — future targets, reversal areas, or important reaction zones when SPX returns to them.
I keep the 25% and OTE levels of old RTH gaps marked as potential reaction zones. A return to an old gap does not guarantee a reaction; I still wait for confirmation.
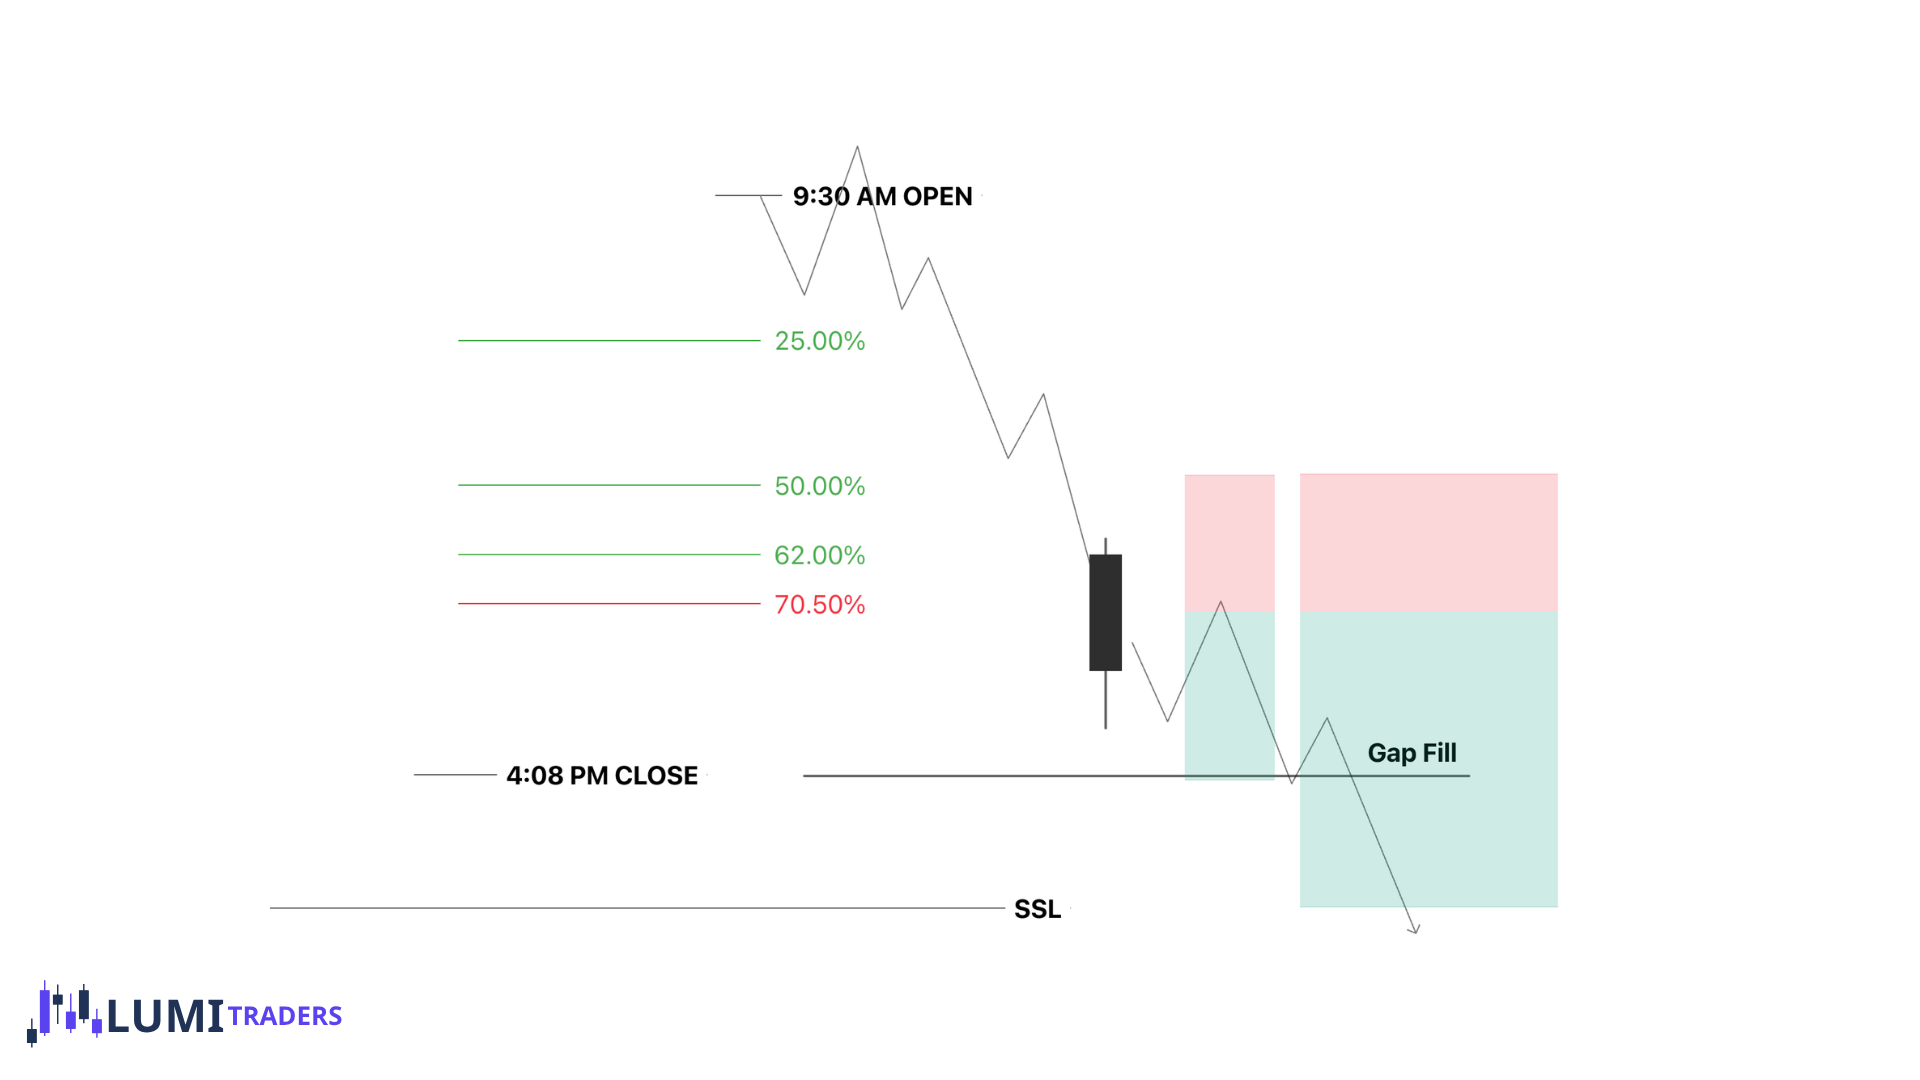
Break of 70.5% - complete fill
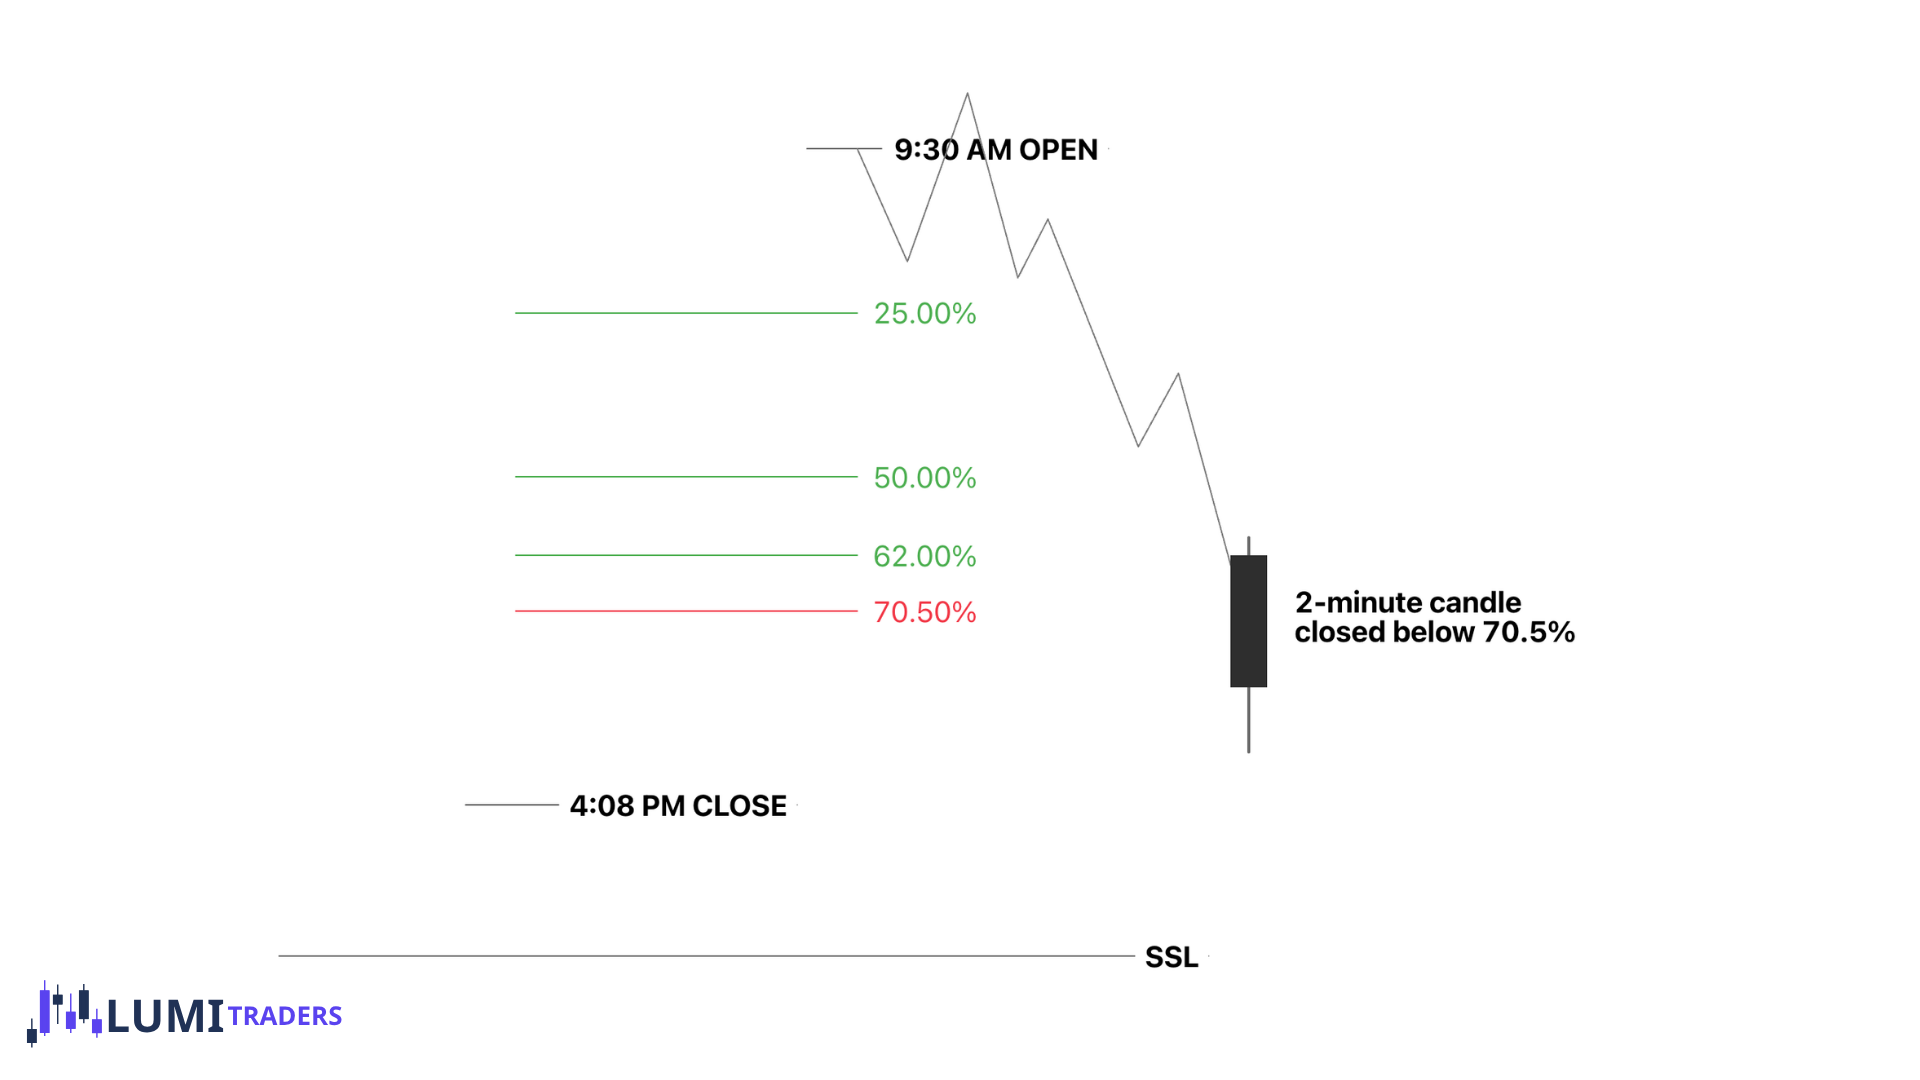
The final scenario occurs when SPX opens and immediately moves into the OTE of the RTH gap. If price breaks through the 70.5% level, this can offer a continuation trade targeting the complete fill of the gap and the opposite liquidity level.
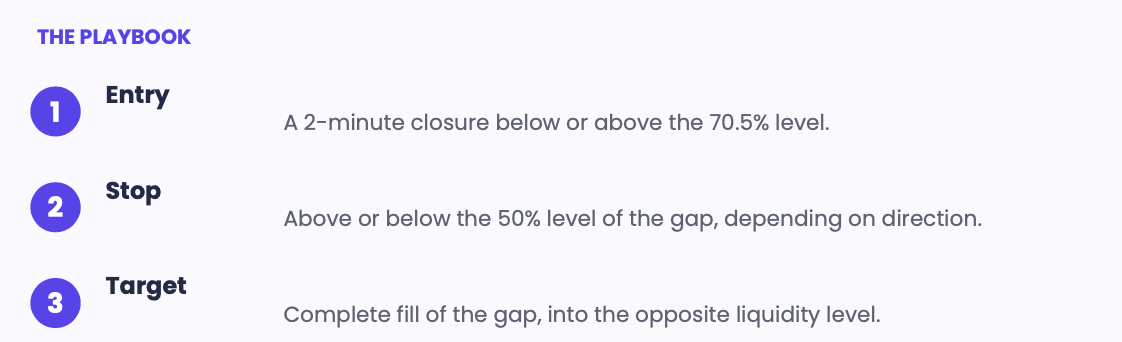
Stop-Loss Placement Based on SPX RTH Gap Size
RTH Gap under 10 points: I typically place my stop loss at the 0% level of the RTH gap.
RTH Gap over 10 points: I place my stop loss below or above the 50% level of the RTH gap, depending on the trade direction.
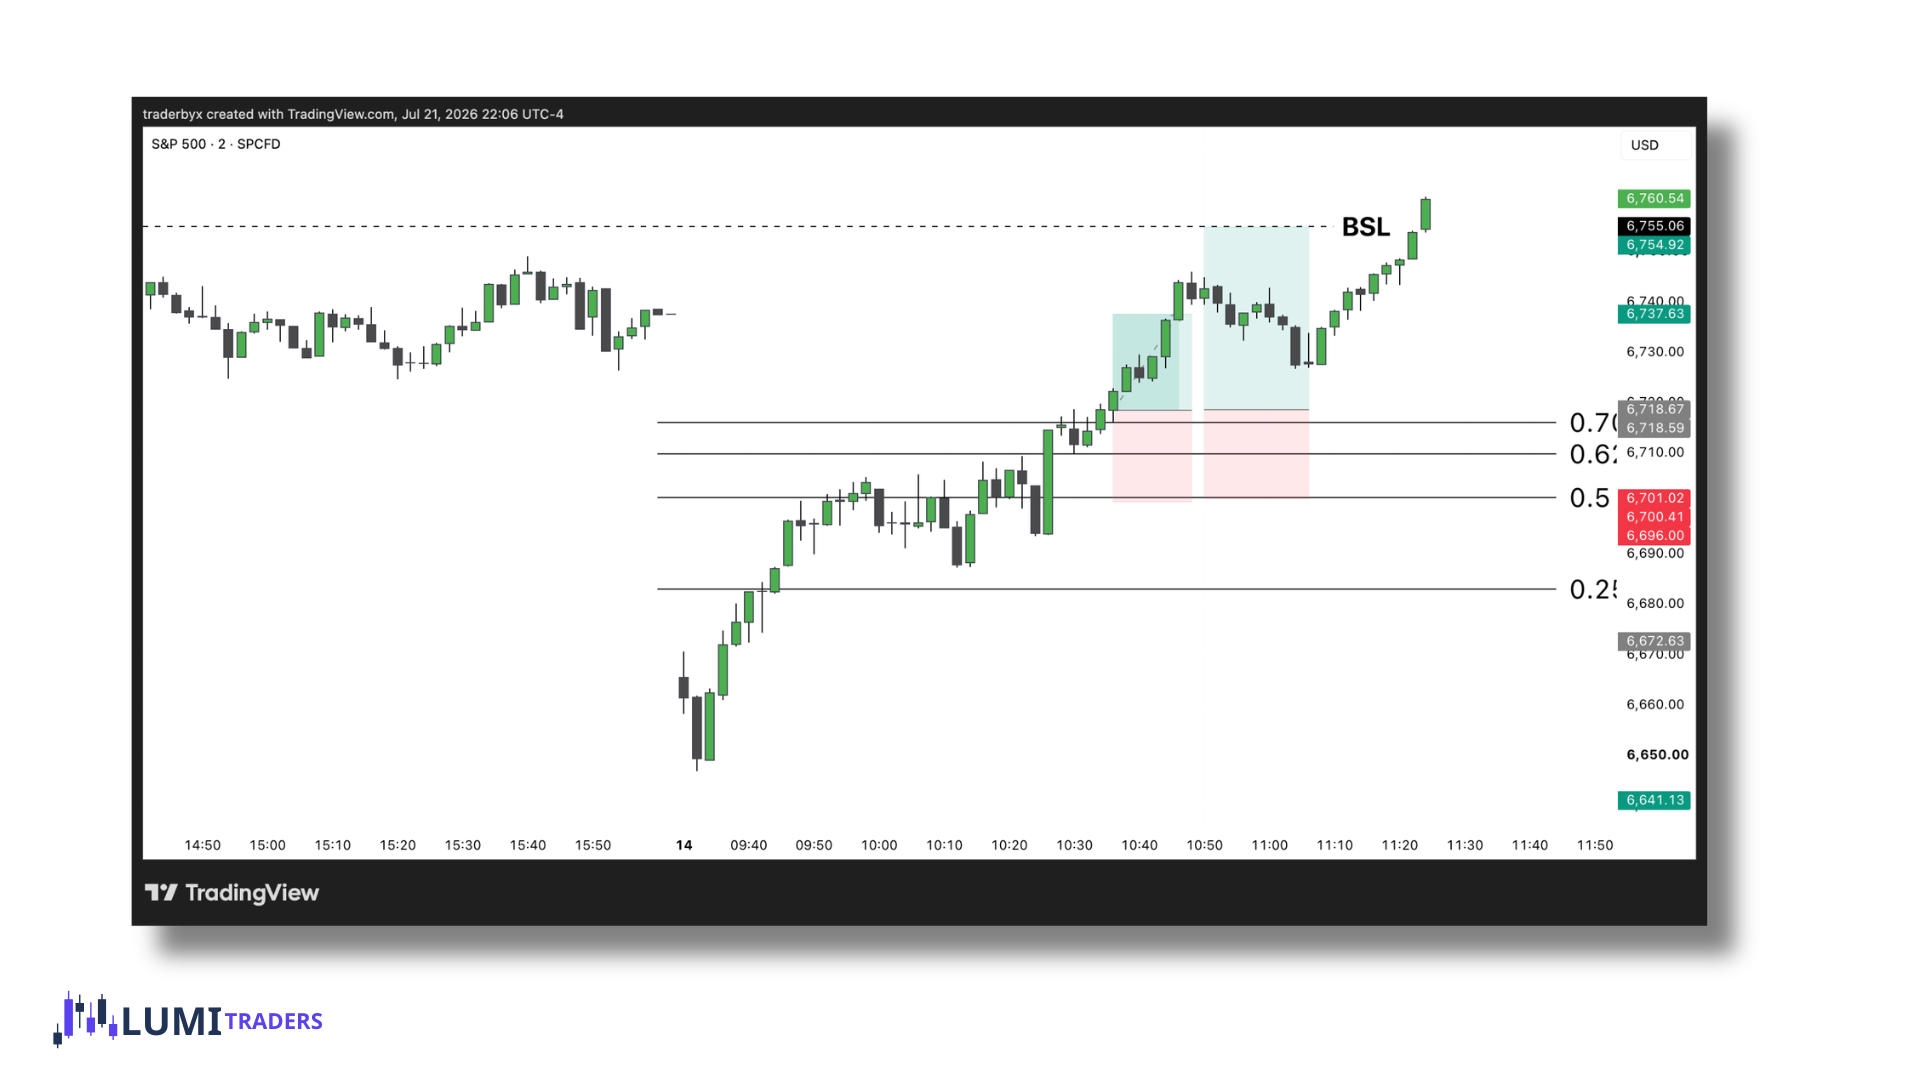
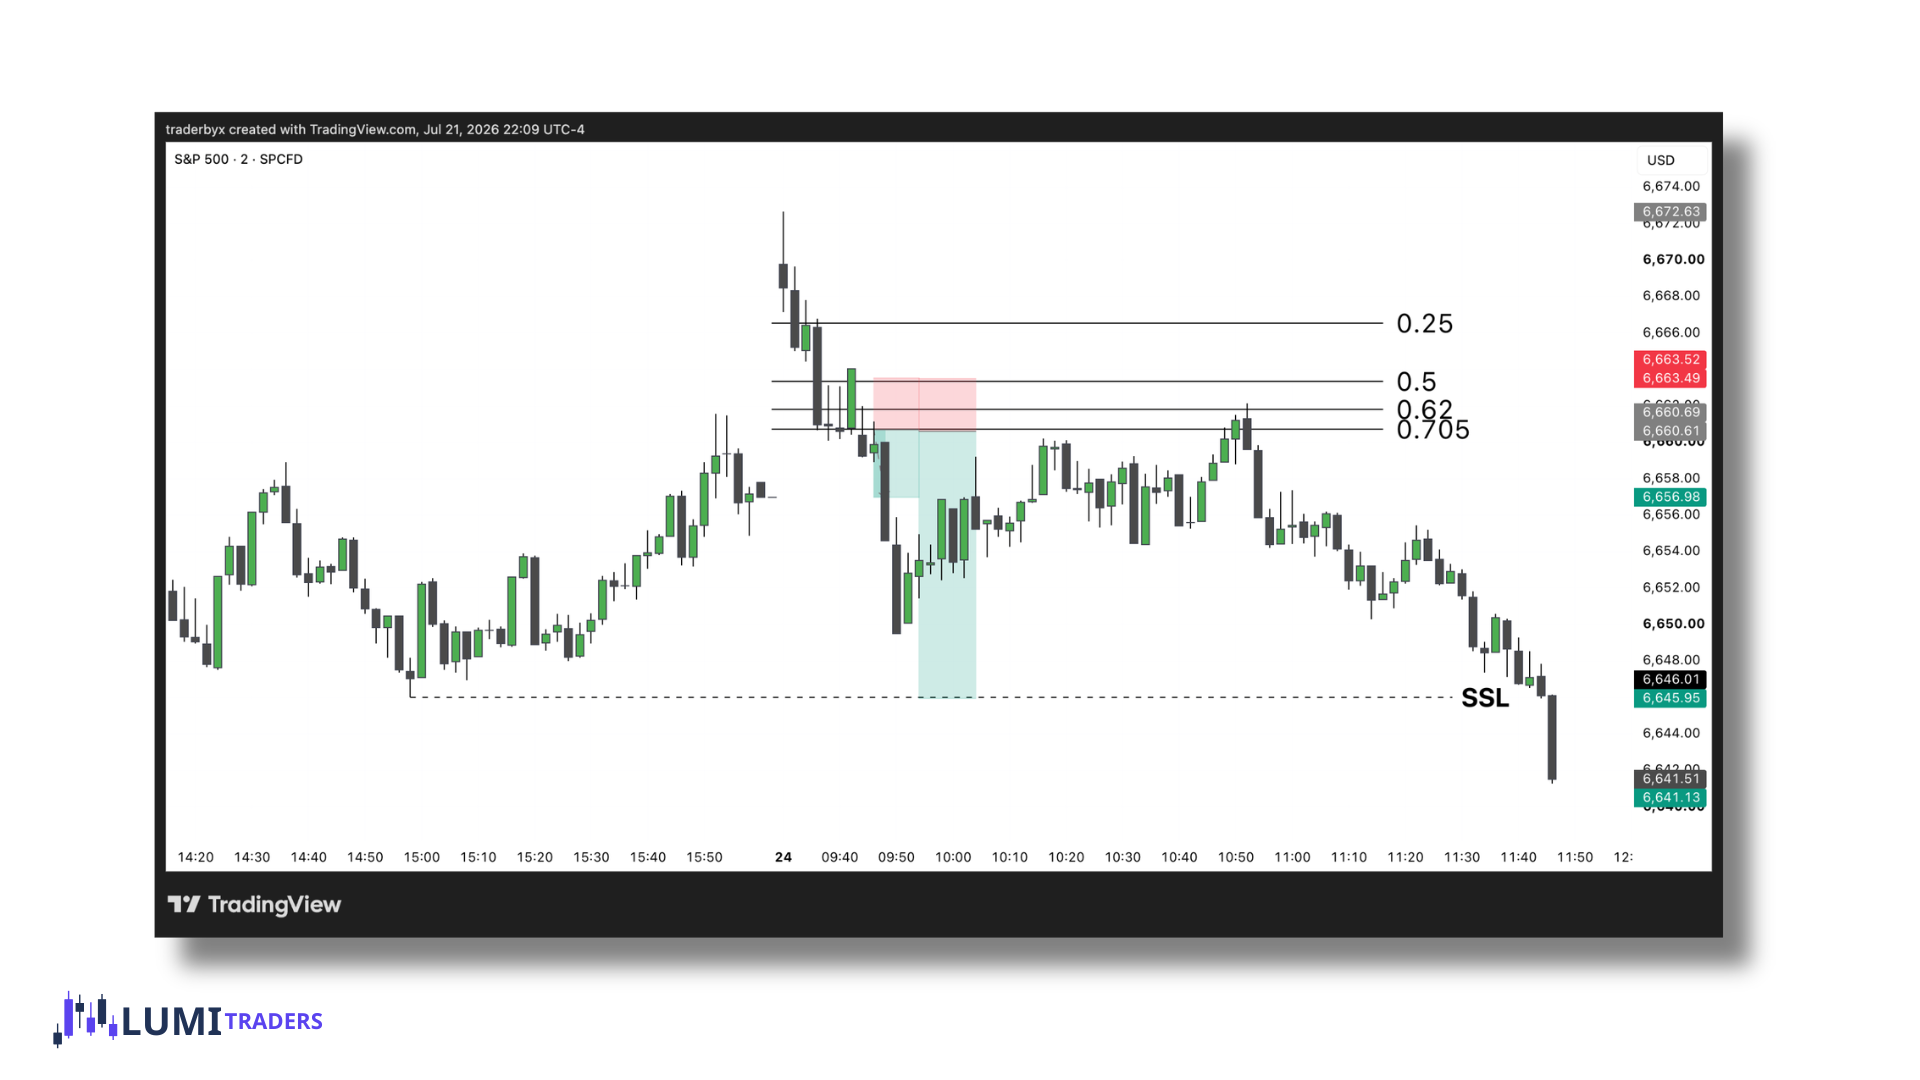
A close beyond 70.5% flips the gap from a reversal map into a continuation map — the target becomes the opposite side of the gap.
What Happens After the Gap Is Filled?
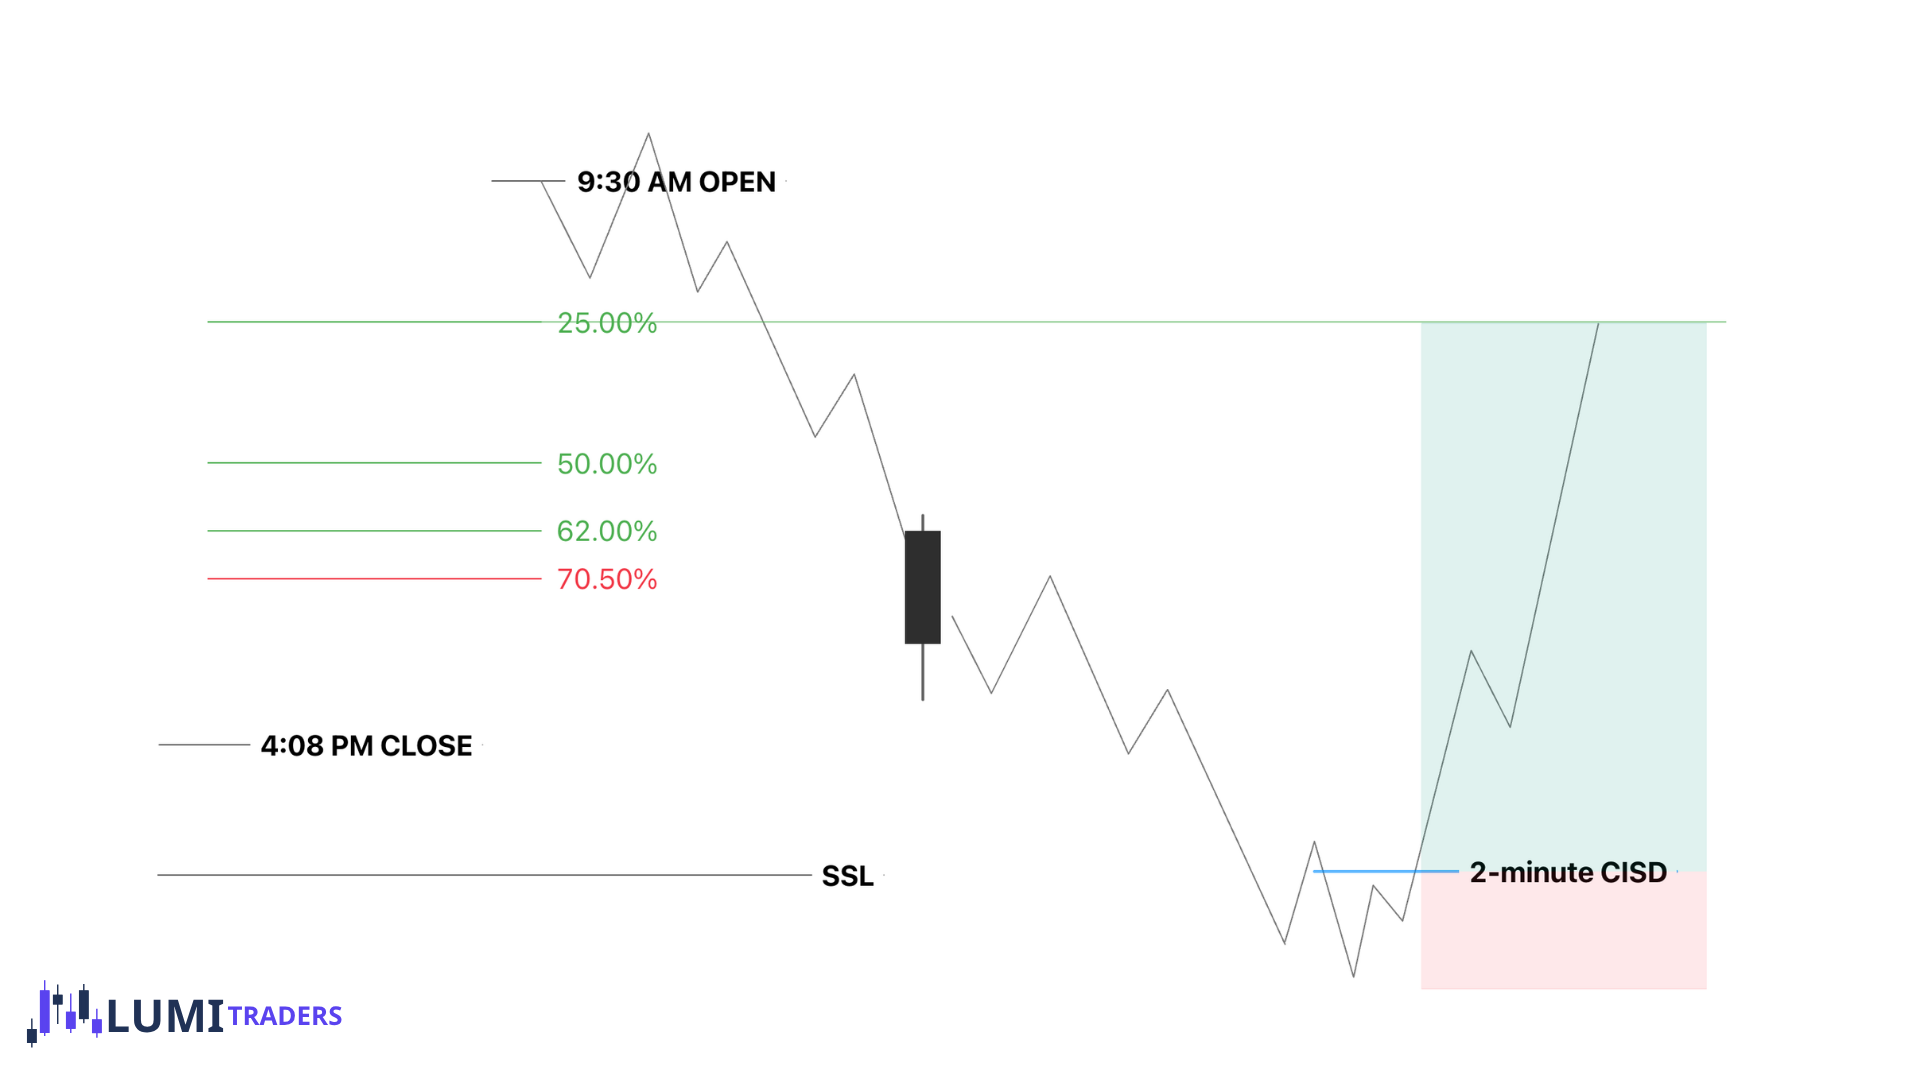
As we learned, when SPX breaks above or below the 70.5% level of an RTH gap, price will often continue to fill the gap and then reach for nearby buy-side liquidity (BSL) or sell-side liquidity (SSL).
But what happens after the gap is filled?
If the gap has been filled while the main higher-timeframe objective remains open, we want to look for a reversal after price takes BSL or SSL.
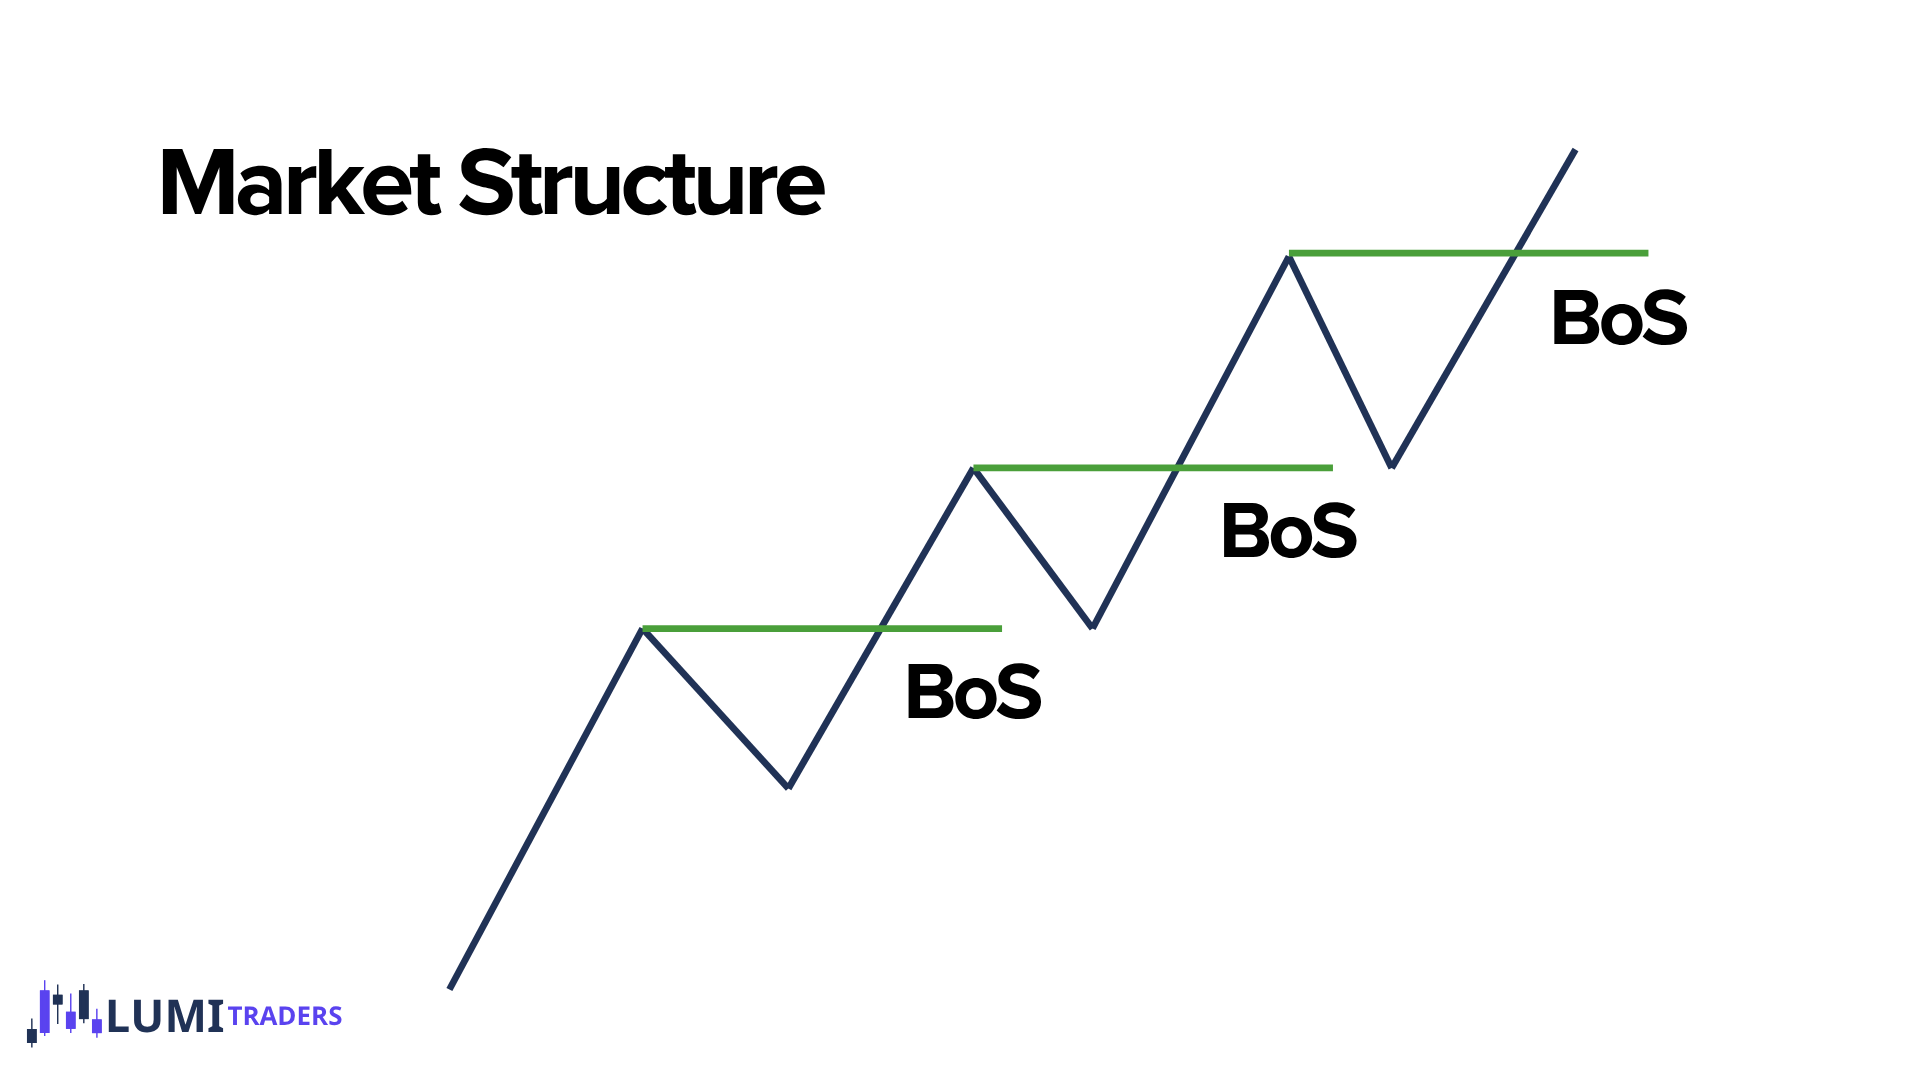
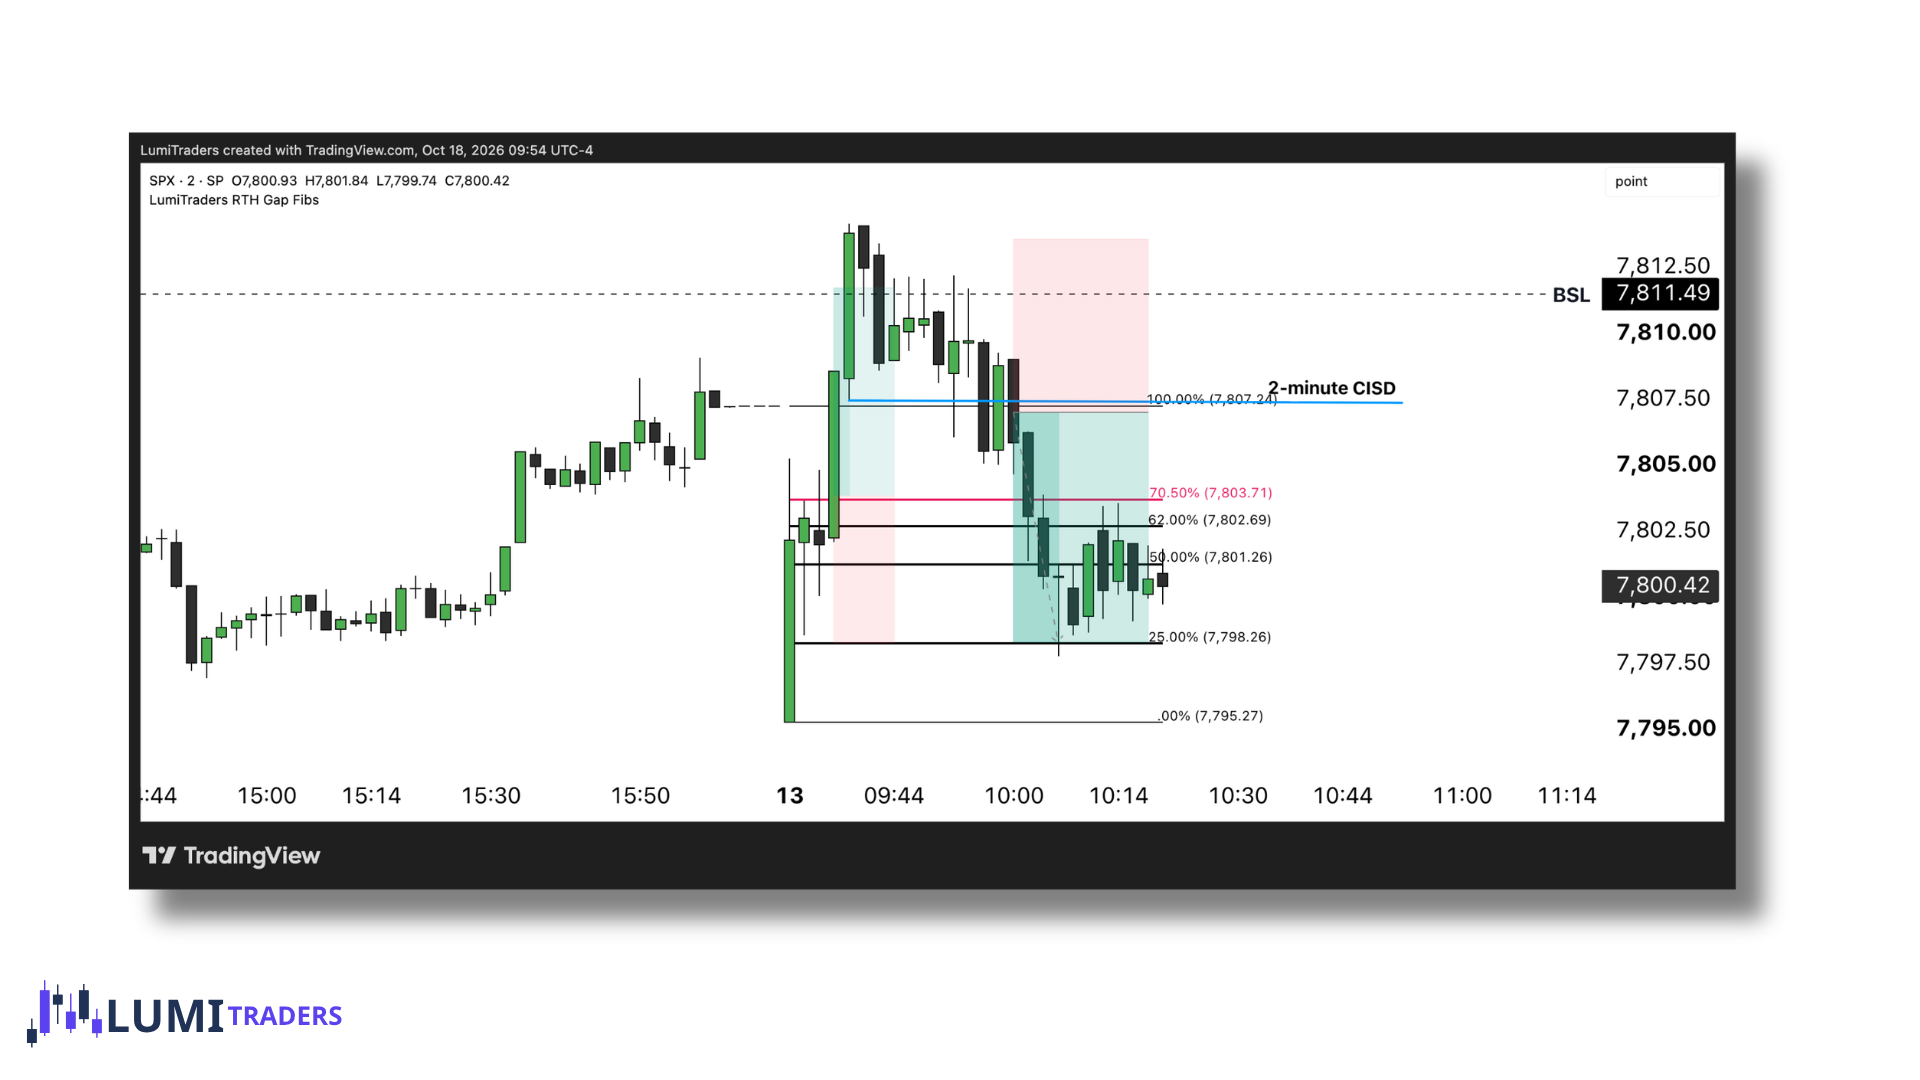
The first trade should be based on a 2-minute market structure shift or CISD. The initial target is the 25% level of the RTH gap, because this level can act as a barrier and produce a reaction.
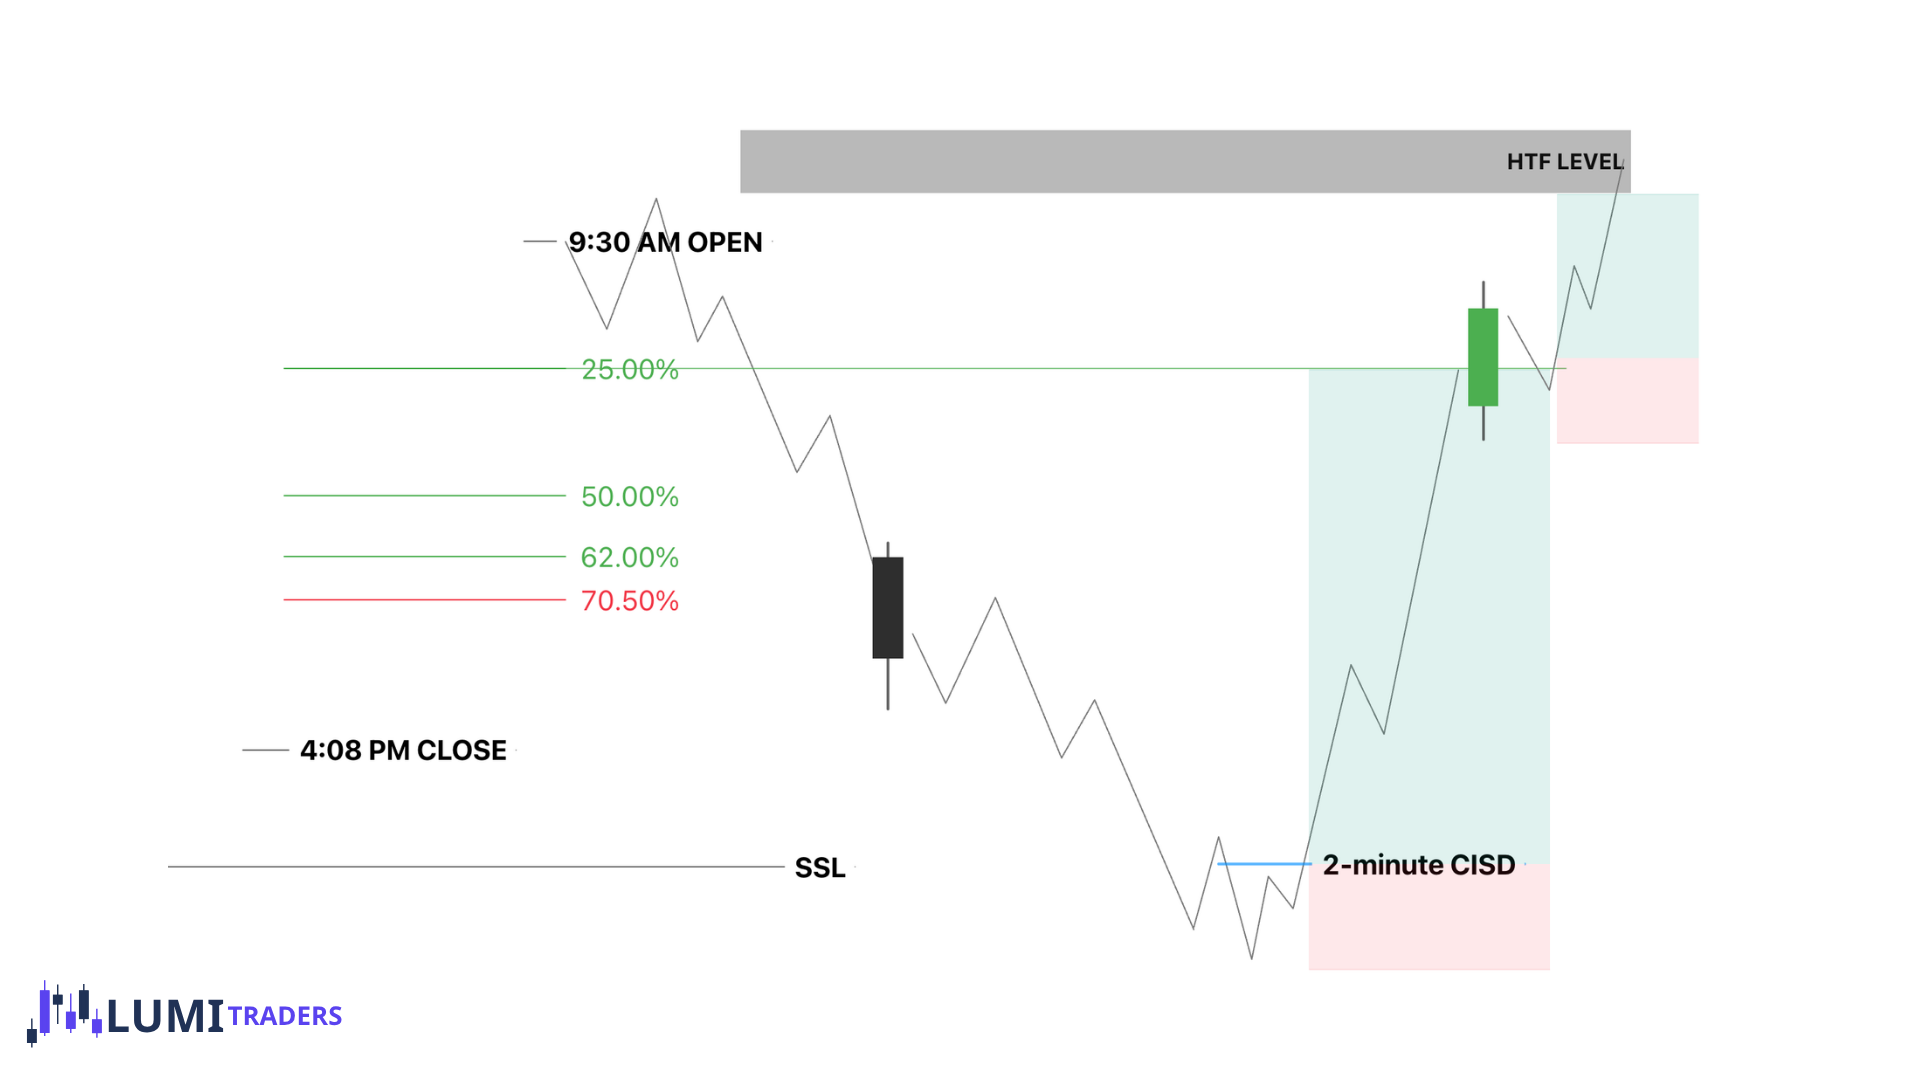
For example, if the main objective remains higher, price may first take SSL and then retrace back toward the gap. The 25% level becomes the first target.
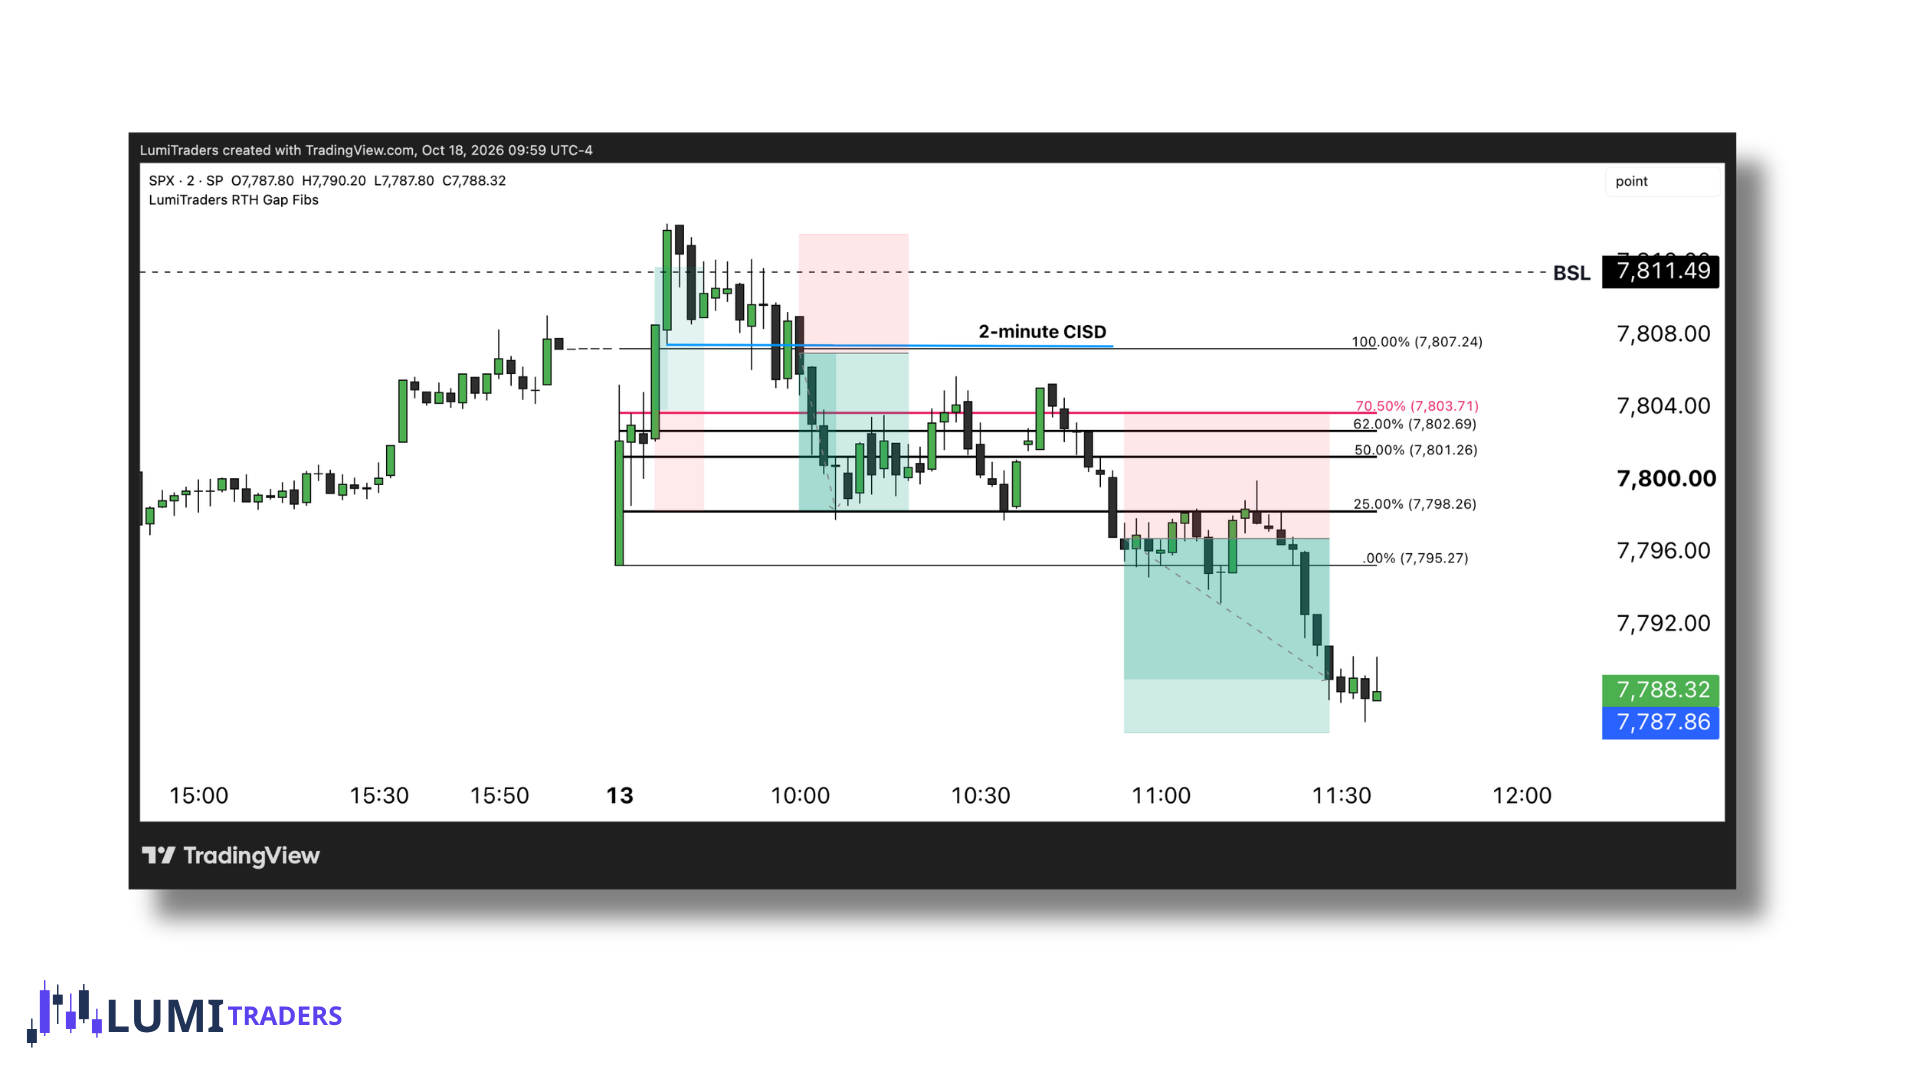
From there, one of two scenarios is likely to unfold: price may remain within the gap for the rest of the trading session, or it may break and hold beyond the 25% level. Once the 25% level is successfully broken, price is more likely to continue toward the remaining higher-timeframe objective.
The second trade: 2-minute candle closed above/below 25%. Entry at the open of next candle. Target is HTF level.
Why did I use this sequence of down-close candles as my Order Block?
You can learn more about Order Blocks here.
The Overlap Gap
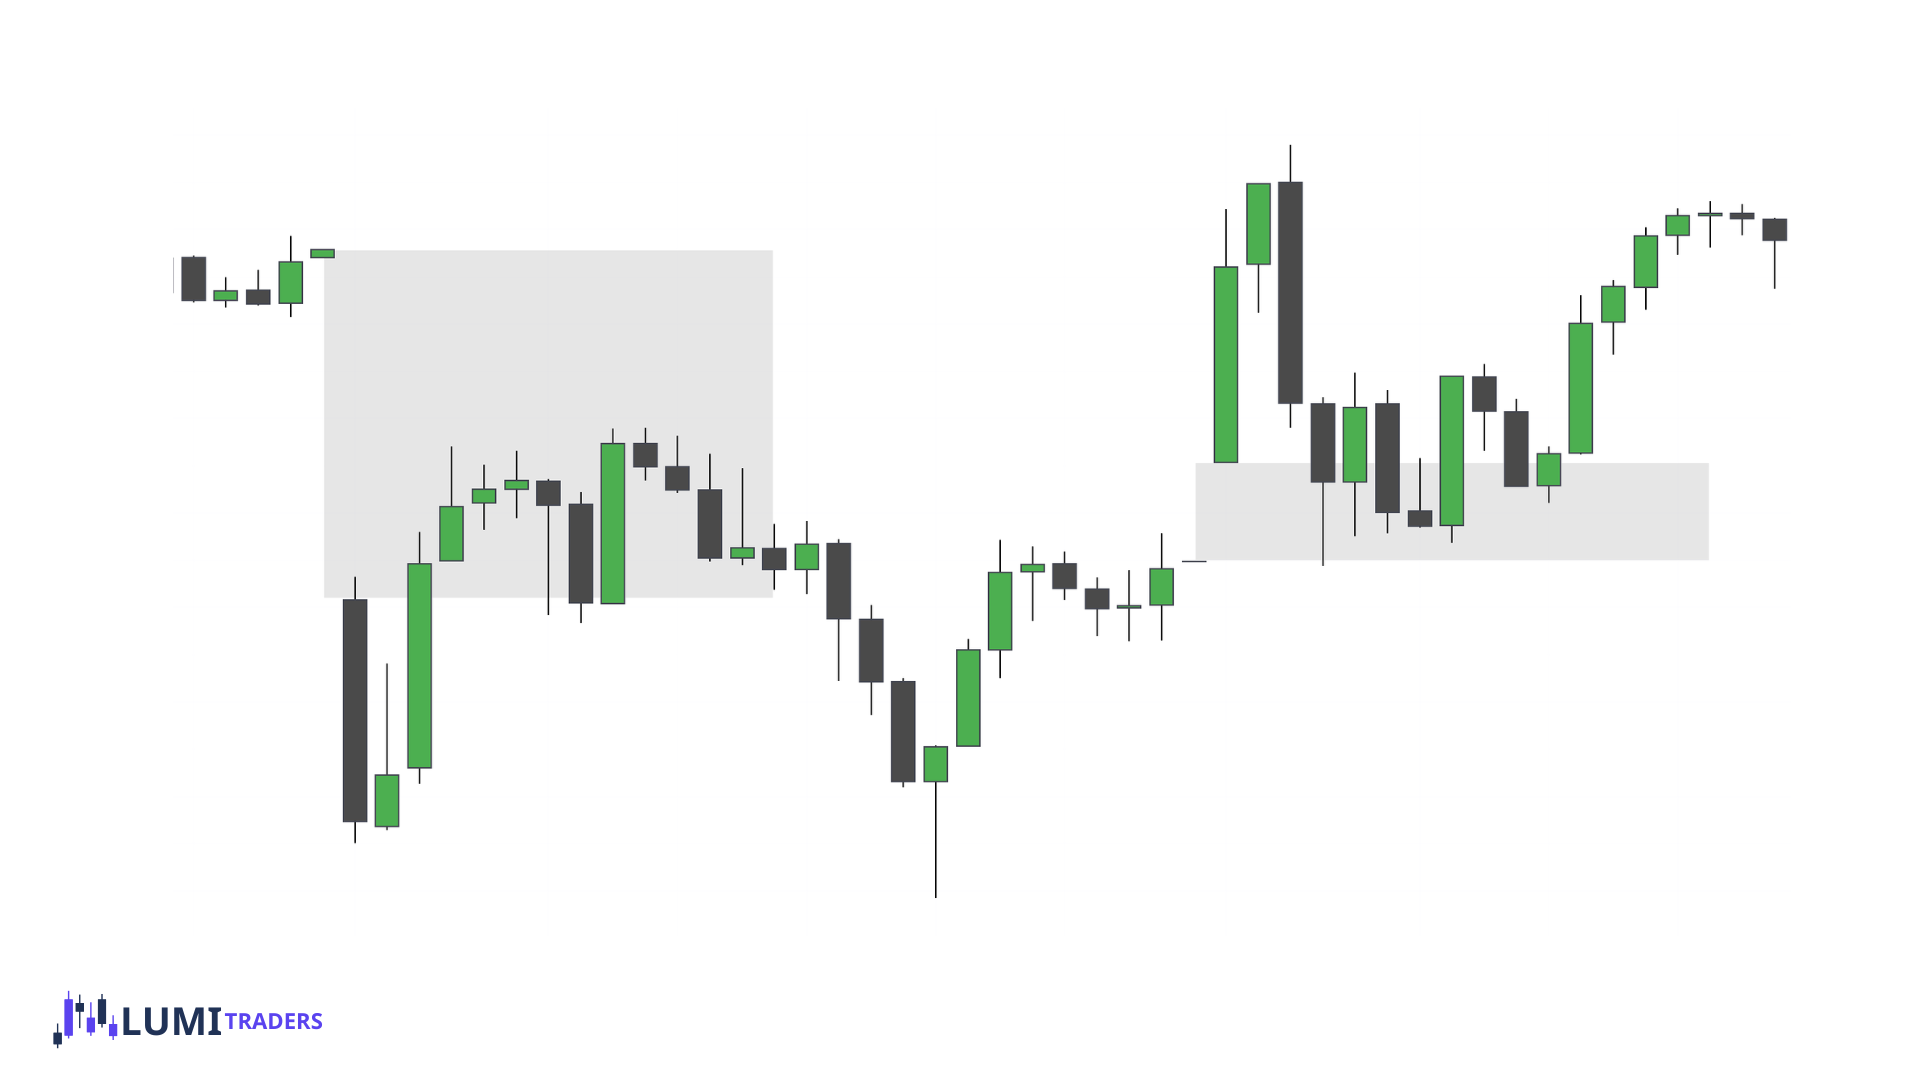
Sometimes SPX opens inside an old unfilled RTH gap, creating a new gap within the old one. The area where the two gaps overlap becomes a key zone — that's where we want to see price retrace and get rejected.
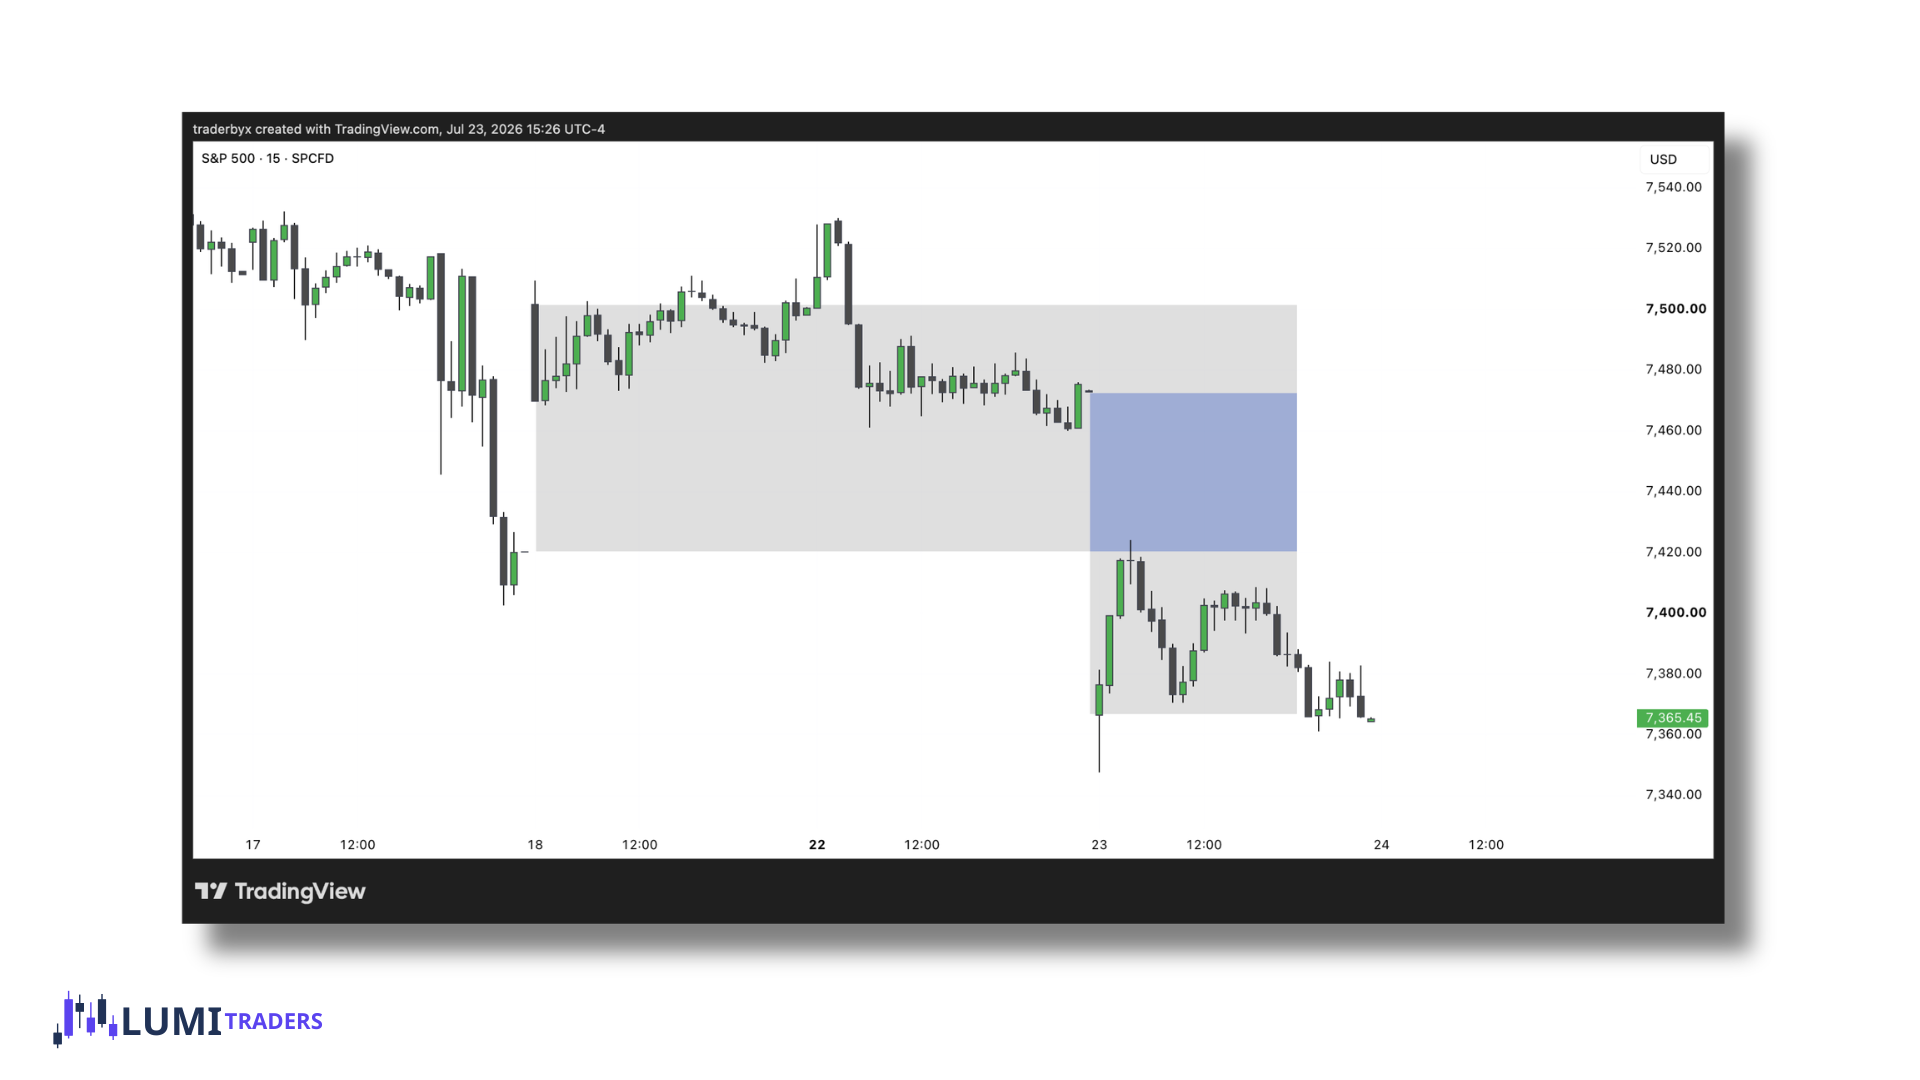
How to trade the overlap gap
We're not going to use the entire overlap area. We only use the overlap between the unfilled portion of the previous gap and the current gap — that's the true overlap zone that matters.
Why? When trading an RTH gap, the goal is to see whether price has balanced everything that happened overnight. Sometimes that balancing is only partial — SPX may reverse from the gap's OTE, leaving part of the gap unfilled. That remaining unfilled portion becomes an area we expect price to revisit in the future — not the same day, but eventually.
When a new gap overlaps the unfilled portion of an old gap, I treat the confluence as a setup worth watching. It combines a prior unfilled area with the current gap. This is my trading framework, not a measured win-rate claim, and the overlap still needs price-action confirmation.
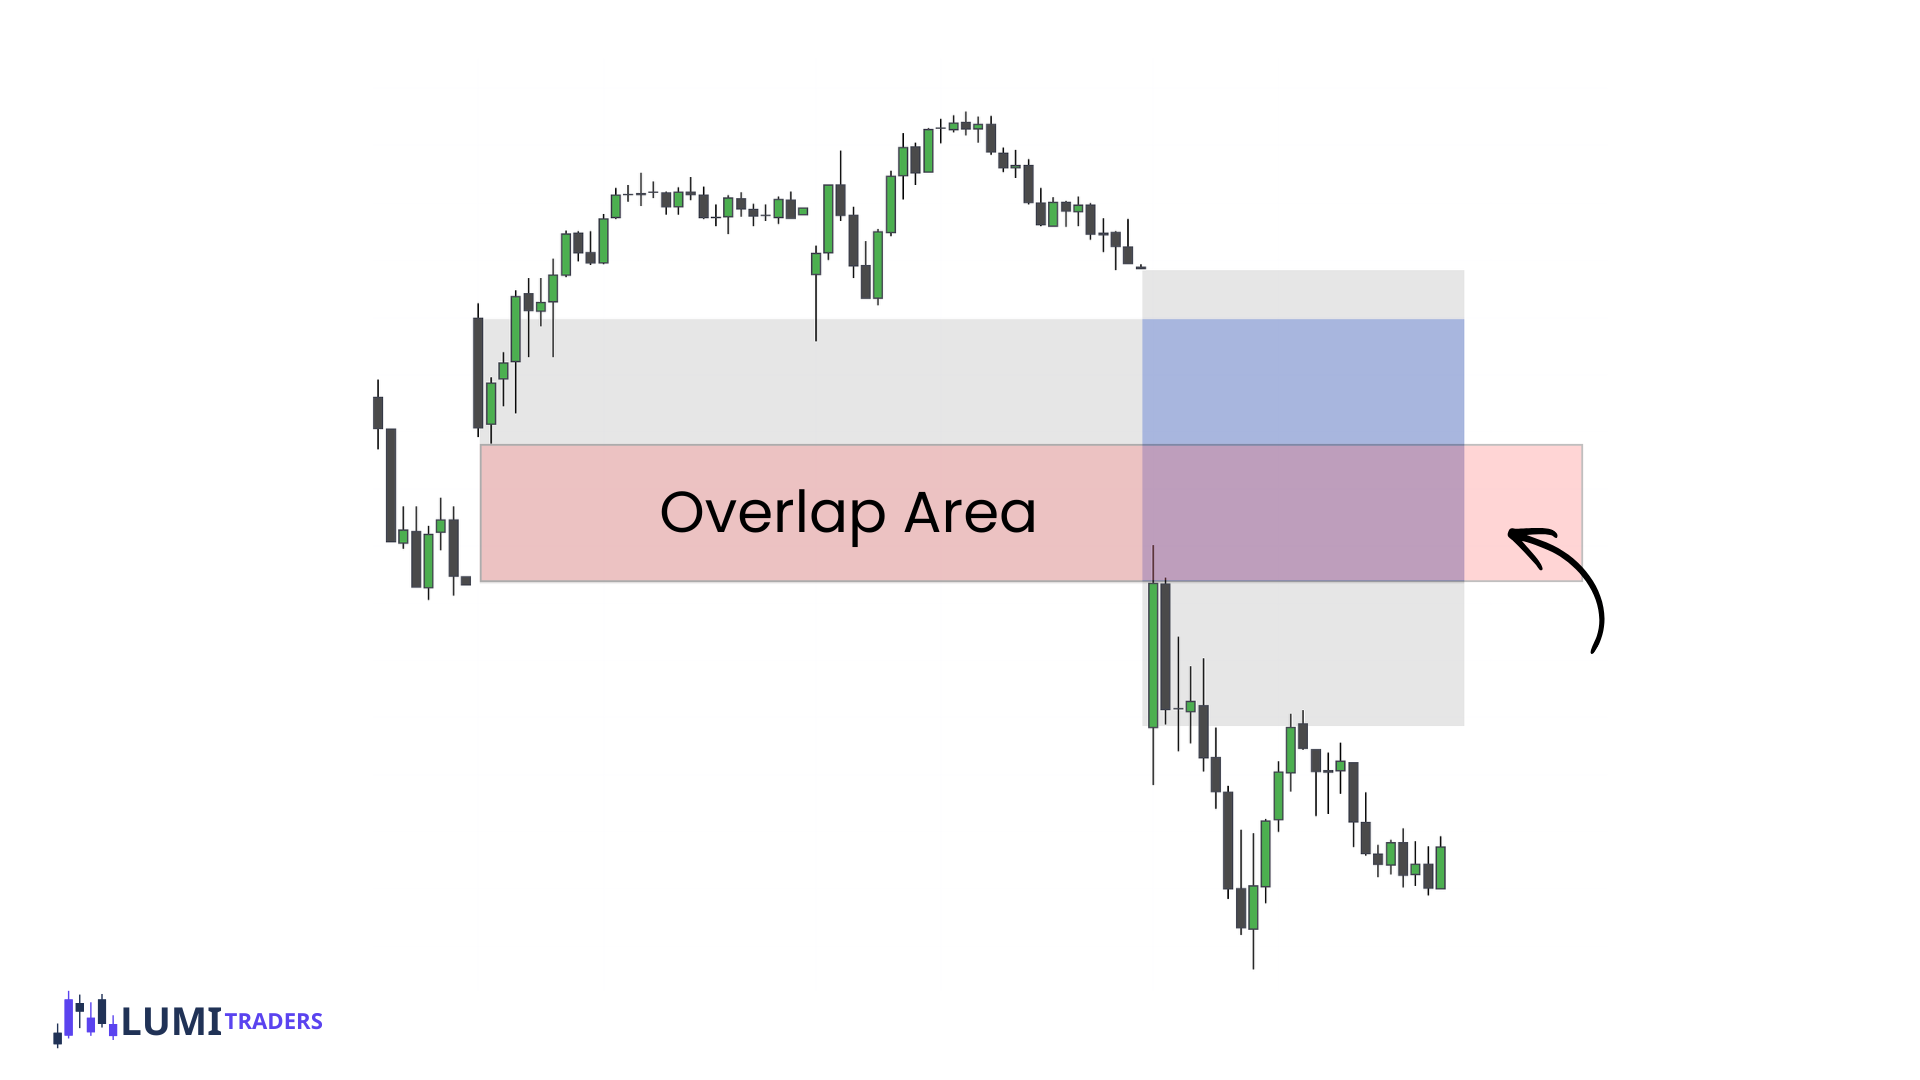
Applying OTE to the overlap zone
Once the overlap zone has been identified, we apply OTE to that overlap area.
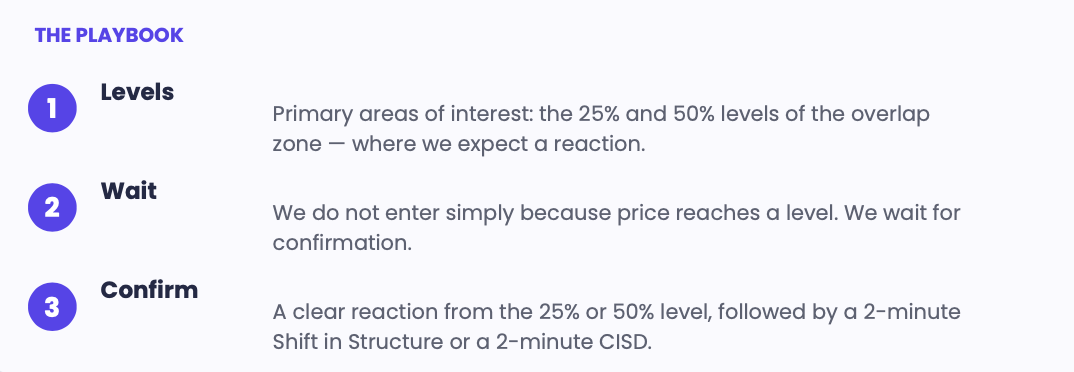
This confirms the market is responding to the overlap zone before we commit to a trade
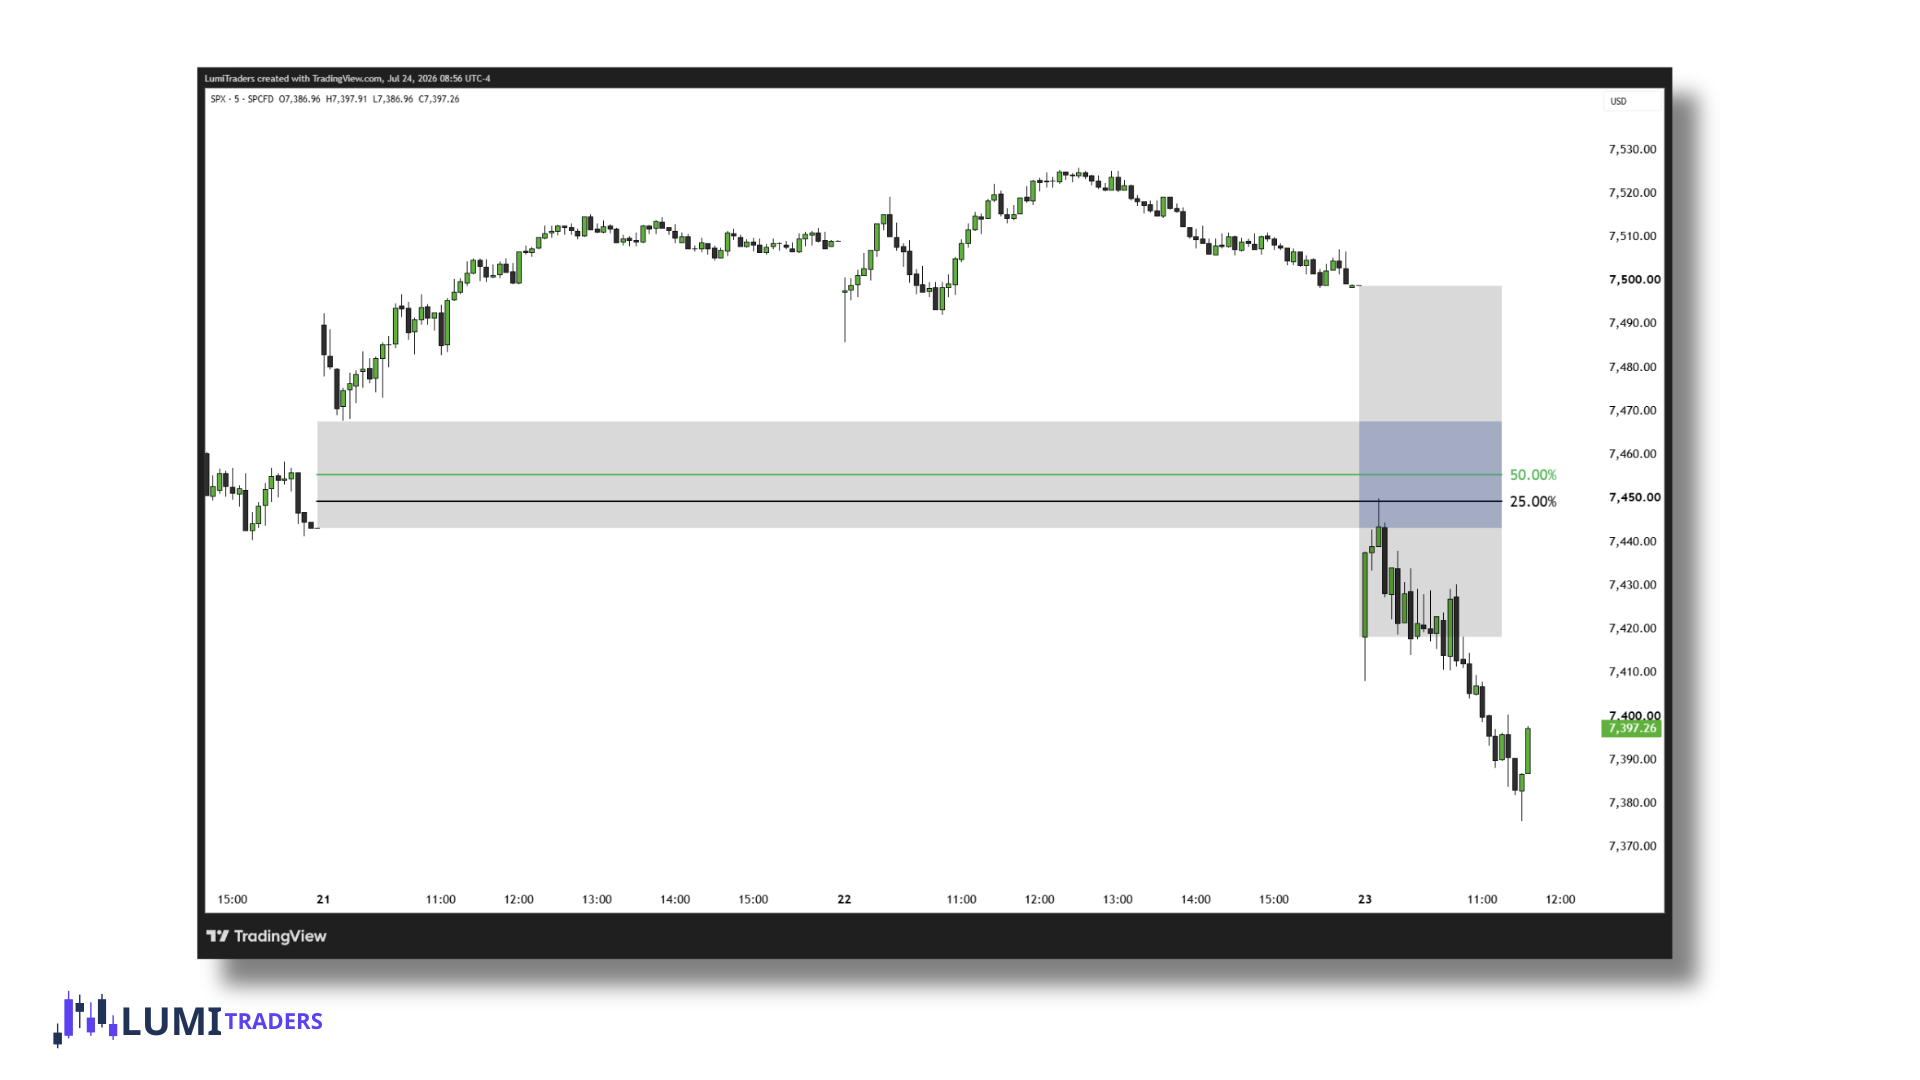
Price seeks balance, not fills
My framework looks for price to balance the overnight move rather than assuming every gap must fill. A partial retracement can be enough; a full fill is never guaranteed.
Of course, SPX may sometimes fill the gap immediately, ignoring both the nearby liquidity level and the OTE. Nothing works 100% of the time. That is exactly why we wait for confirmation from a 2-minute shift in structure or a 2-minute CISD before entering the trade.
We never blindly anticipate a reaction simply because price has reached a Fibonacci level. The level gives us an area of interest — price action must confirm the entry.
Draw this automatically — the free SPX RTH Gap with Fibonacci indicator for TradingView maps the gap and its 25%, 50%, 62% and 70.5% levels, keeps unfilled gaps on the chart and marks overlap zones.
LumiTraders strategy questions
Do you trade SPX or ES?
I mark the reference levels on SPX and execute on ES futures. The futures price can differ from the cash index, so I read the reaction rather than copying an SPX price directly into an ES order.
What confirmation does LumiTraders use?
I look for a 2-minute CISD or market-structure confirmation in the relevant gap and liquidity scenario. Touching a Fibonacci level alone is not an entry signal.
Does every RTH gap have to fill?
No. My framework includes partial retracements, complete fills and old unfilled gaps. I keep unfilled zones marked without assuming a guaranteed return.
Where can I see the strategy used live?
My official YouTube livestream channel contains my regular trading sessions. I use this setup daily; the written lesson describes the rules, while the streams show the wider decision process.
Key takeaways
- Map SPX references; execute and size risk on the contract you trade.
- Wait for confirmation instead of entering solely at a Fibonacci level.
- Treat unfilled gaps as possible reference zones, not guaranteed targets.