Before you begin
What you’ll learn
- Po3
Power of Three / Po3
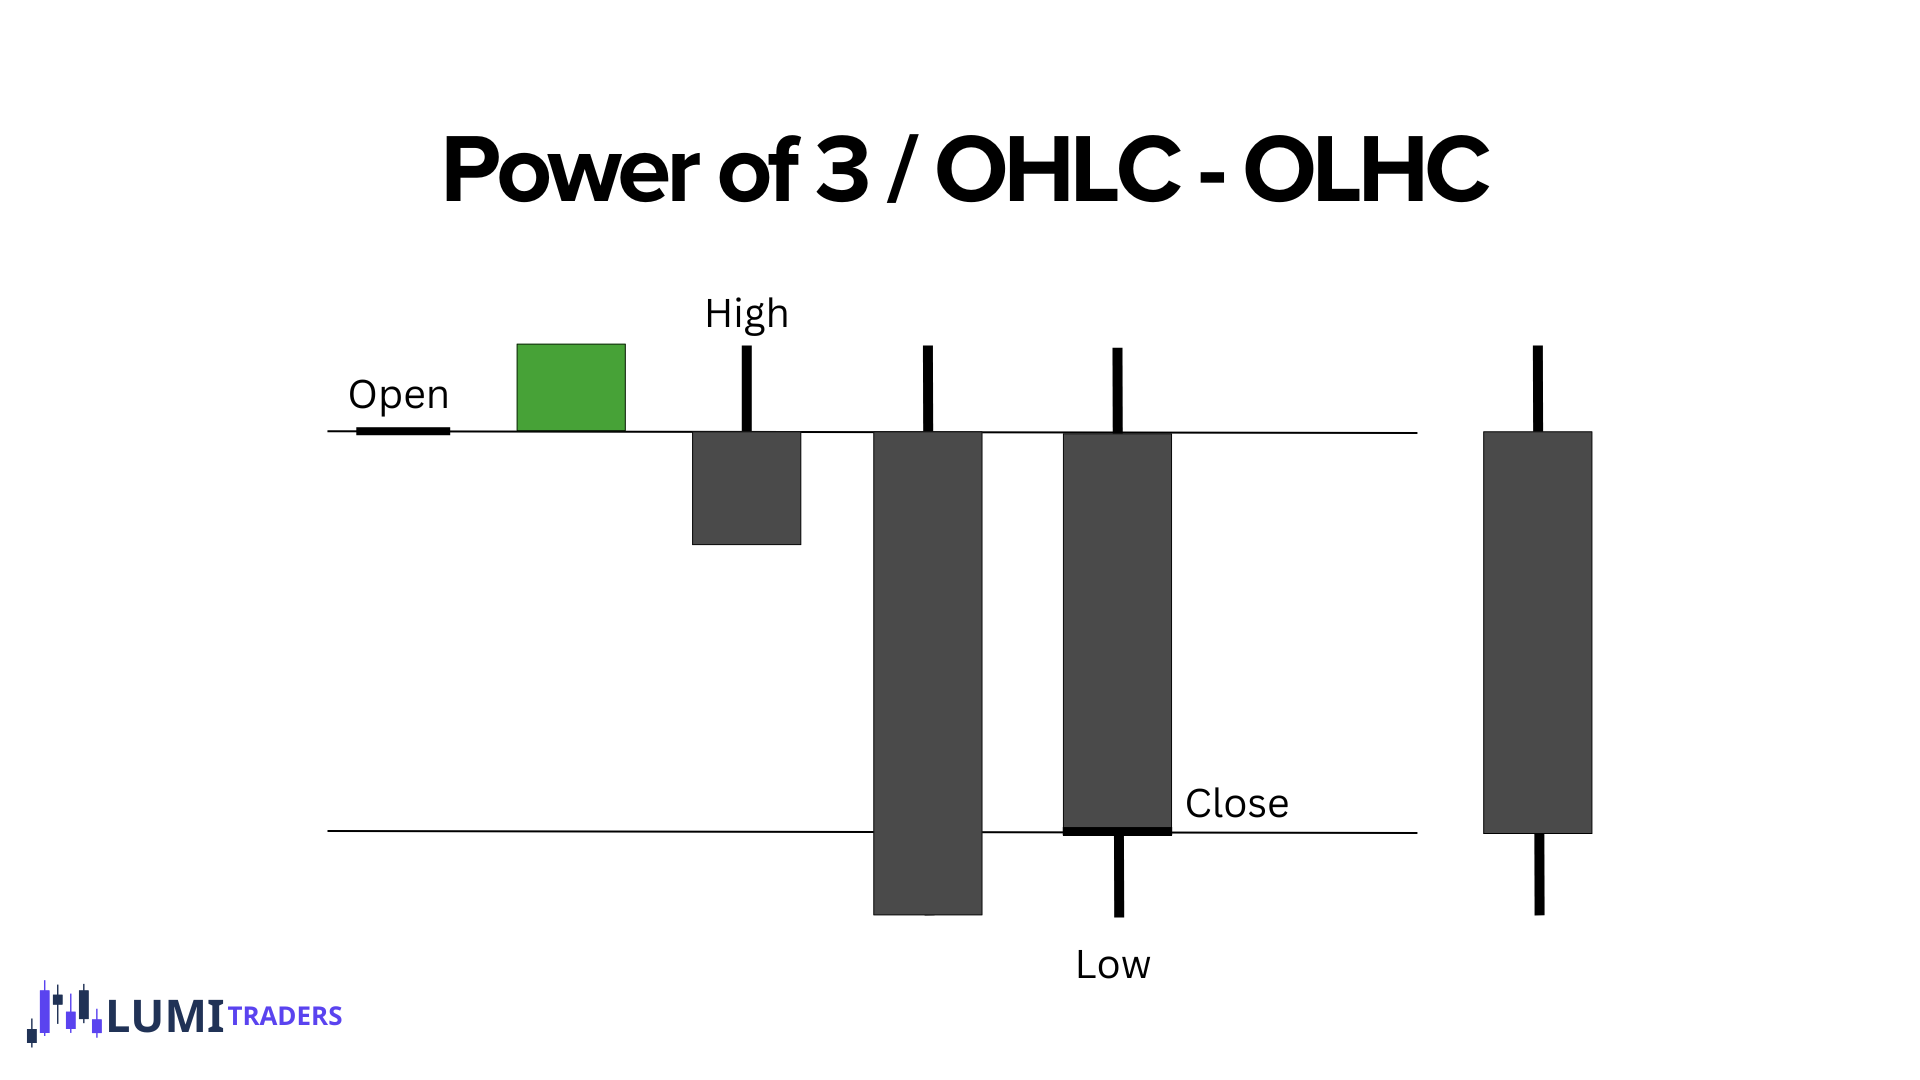
AMD/PO3 (Power of Three) means Accumulation, Manipulation, and Distribution.
Accumulation
Price consolidates near the opening price.
During accumulation, the market may trade in a small range while liquidity builds above and below short-term swing points.
This stage may appear quiet and directionless.
However, the market is often preparing for the next move.
Manipulation
Forms the Low/High of a candle. Price temporarily moves in the opposite direction of the intended expansion.
This move is designed to take liquidity, trigger stop losses, and attract traders into the wrong side of the market.
In a bullish Power of 3, manipulation usually moves below the opening price.
In a bearish Power of 3, manipulation usually moves above the opening price.
Distribution
This is the range-expansion phase—a low-resistance liquidity run that occurs after manipulation. This is where the body of the candle forms.
These three stages help us understand how a candle may form from its open to its close.
For a bullish candle, price will often follow an Open–Low–High–Close formation.
For a bearish candle, price will often follow an Open–High–Low–Close formation.
Understanding these formations can help us anticipate where manipulation may occur and which direction price may deliver afterward.
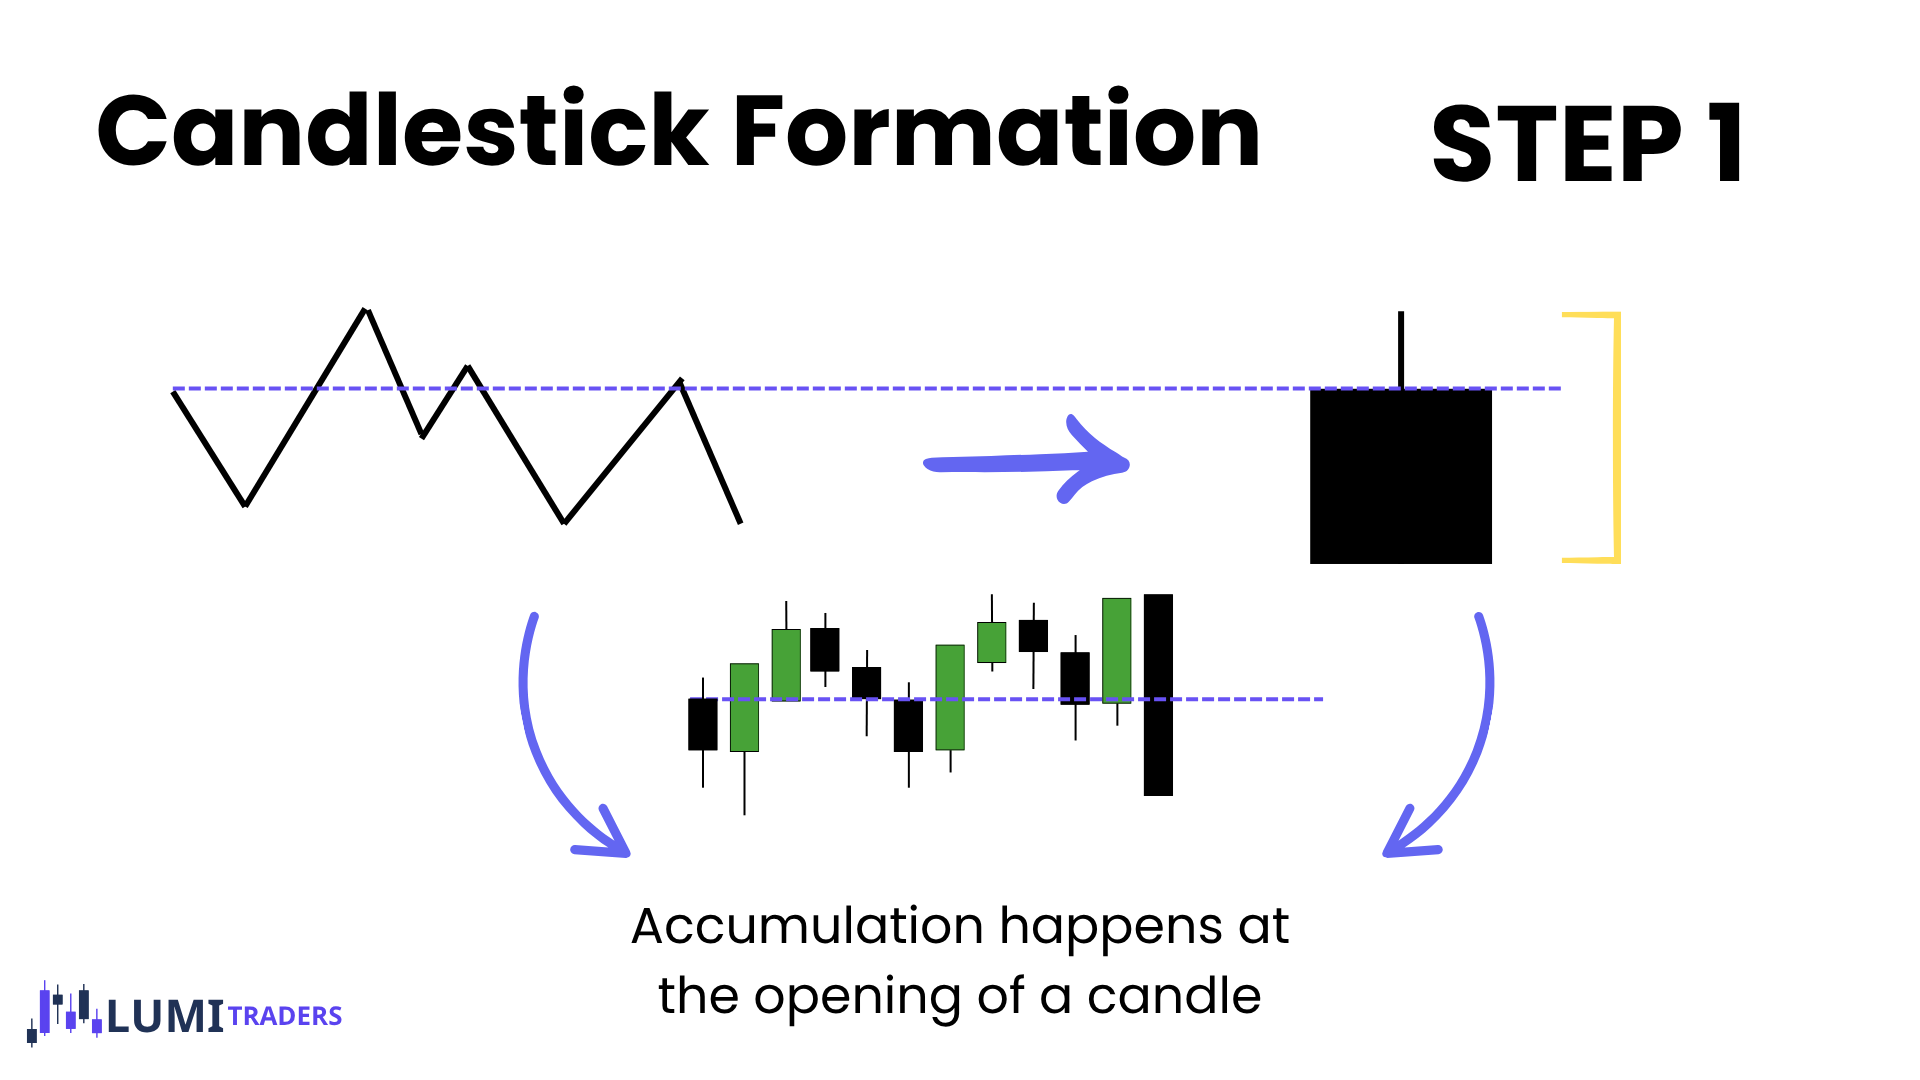
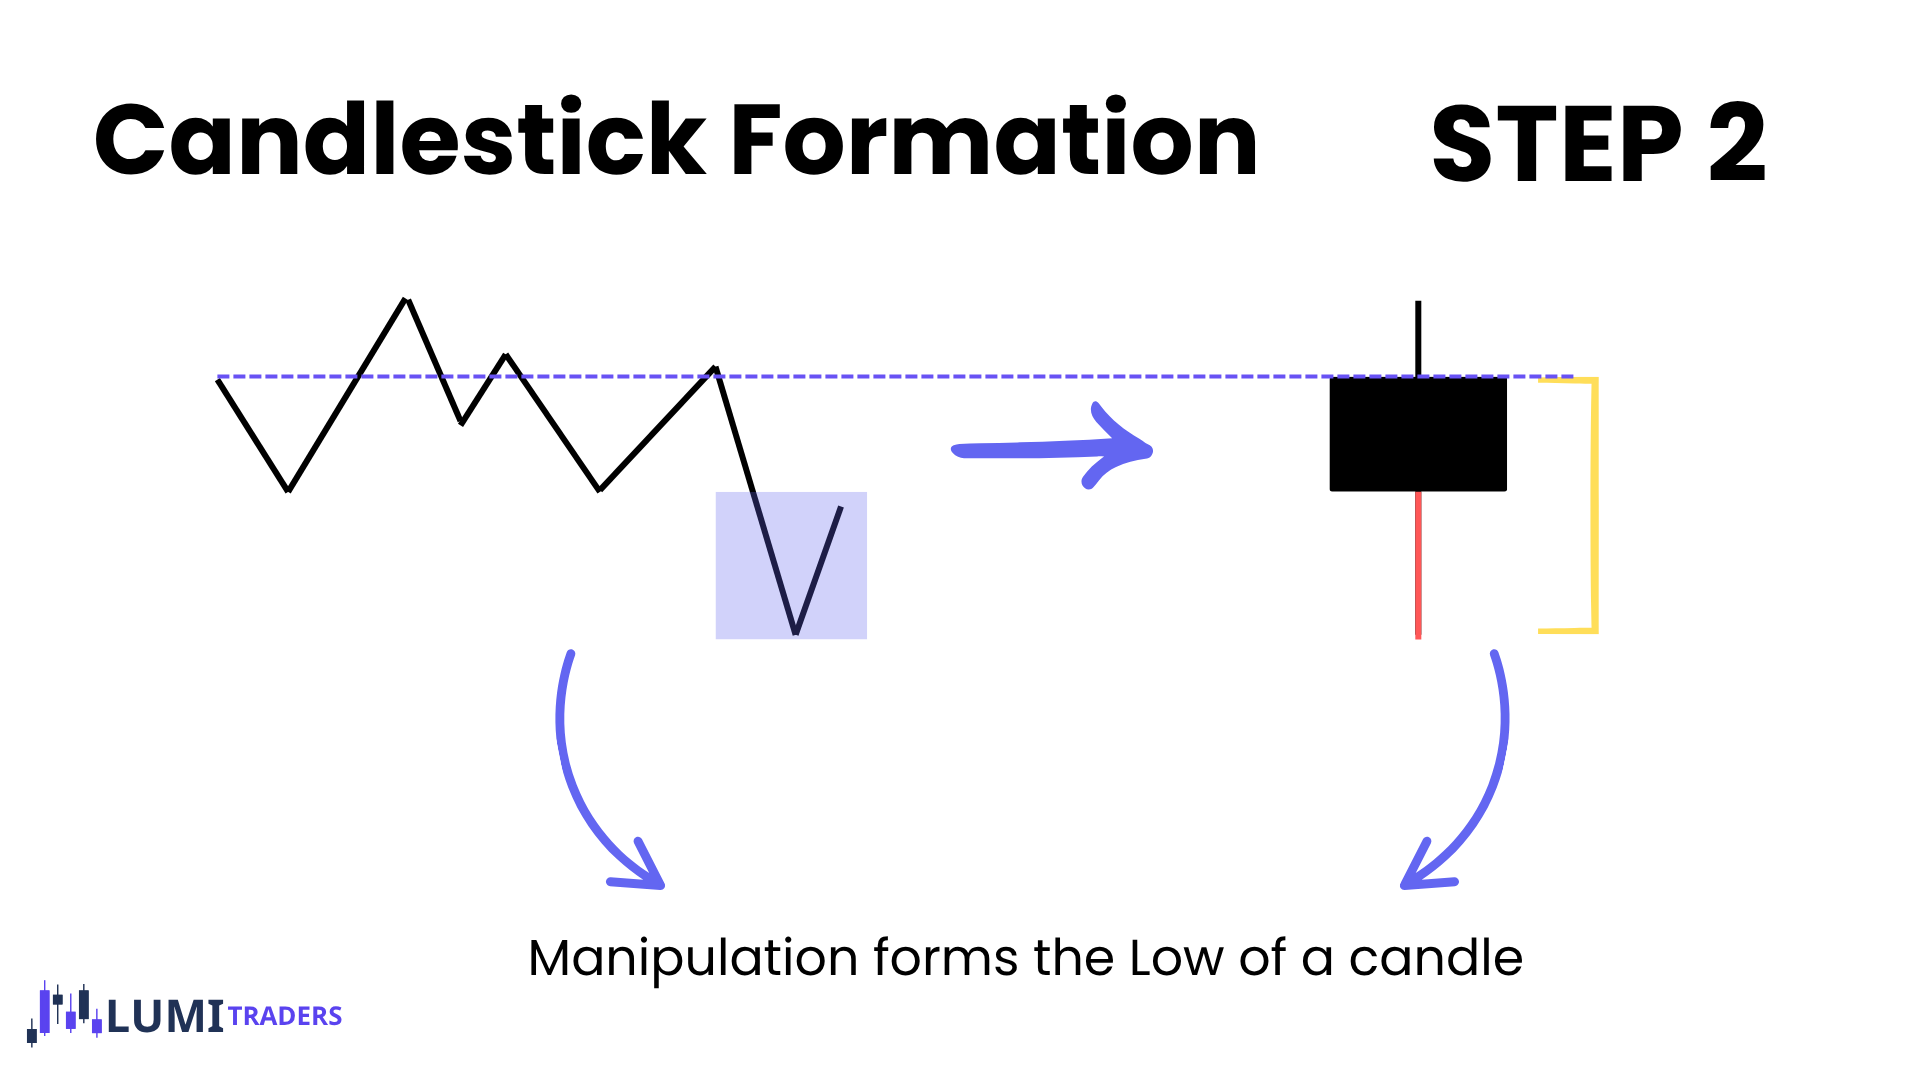
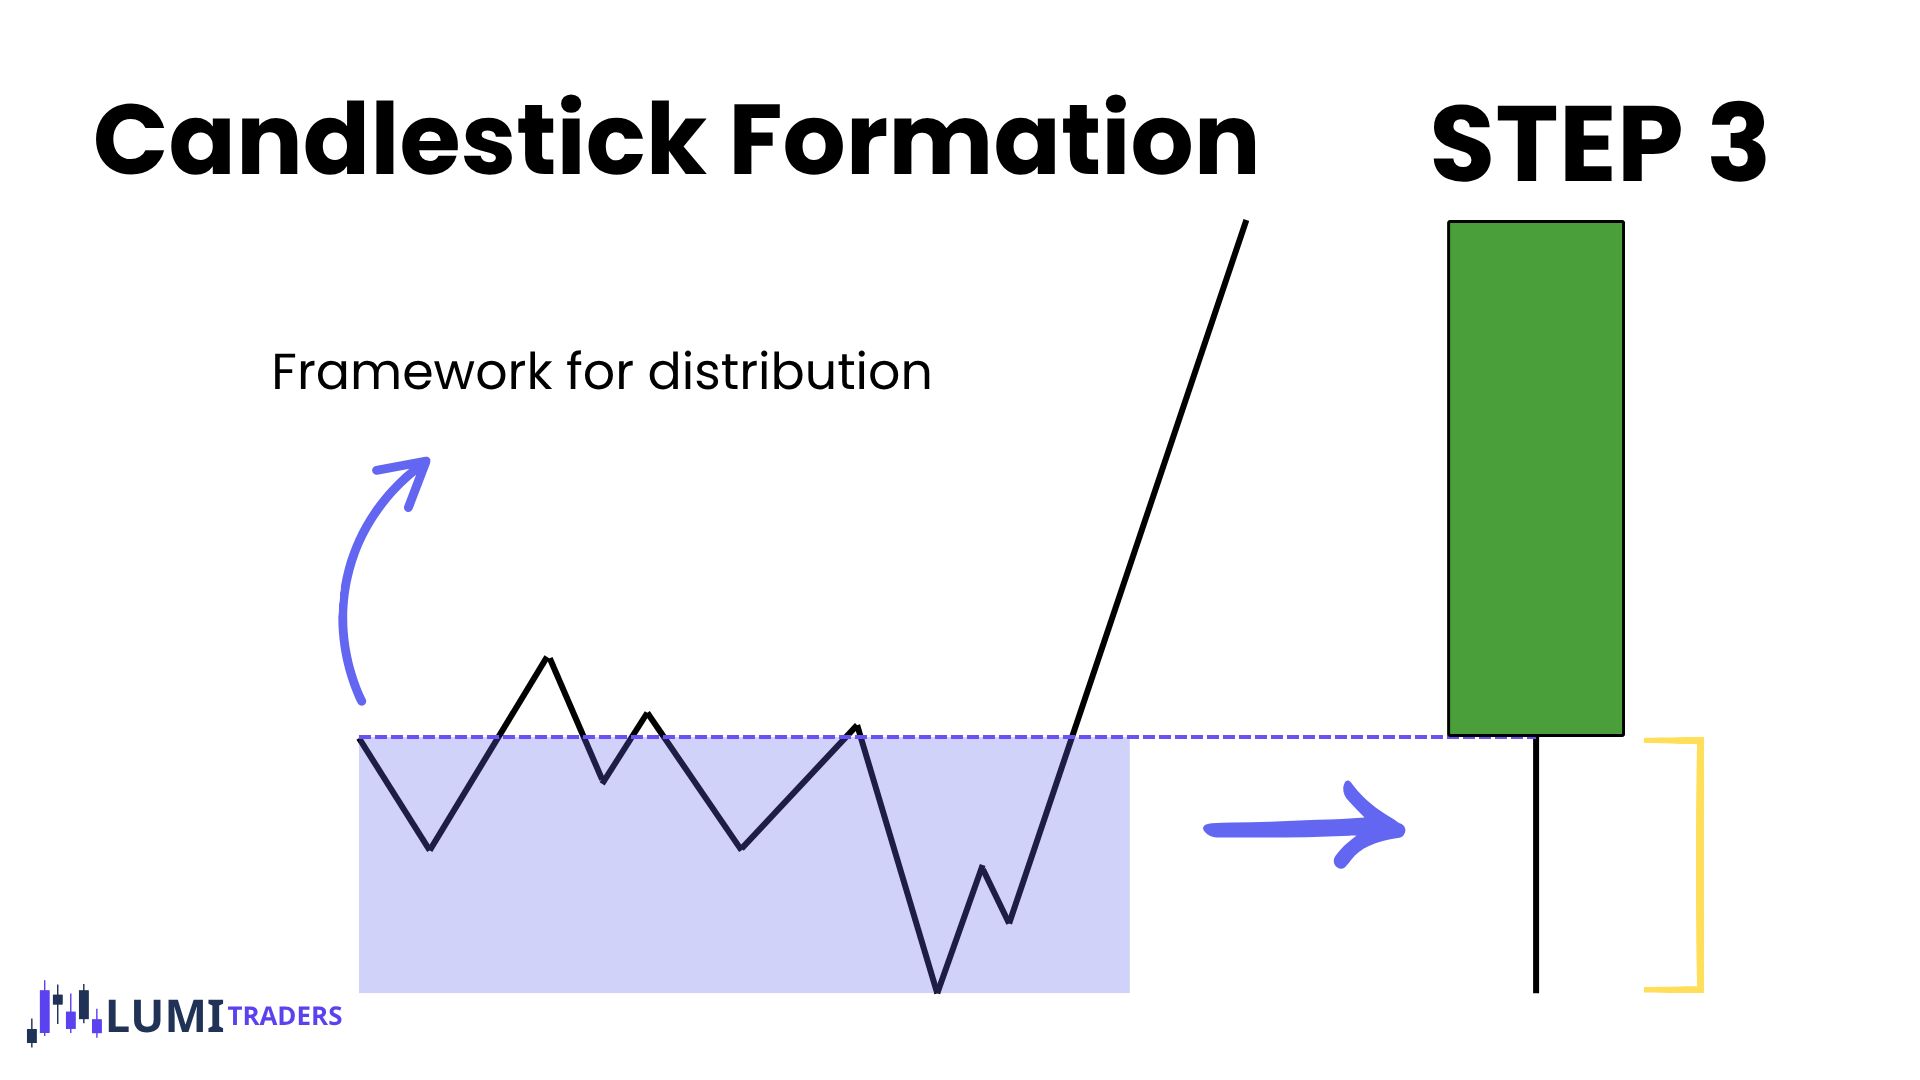
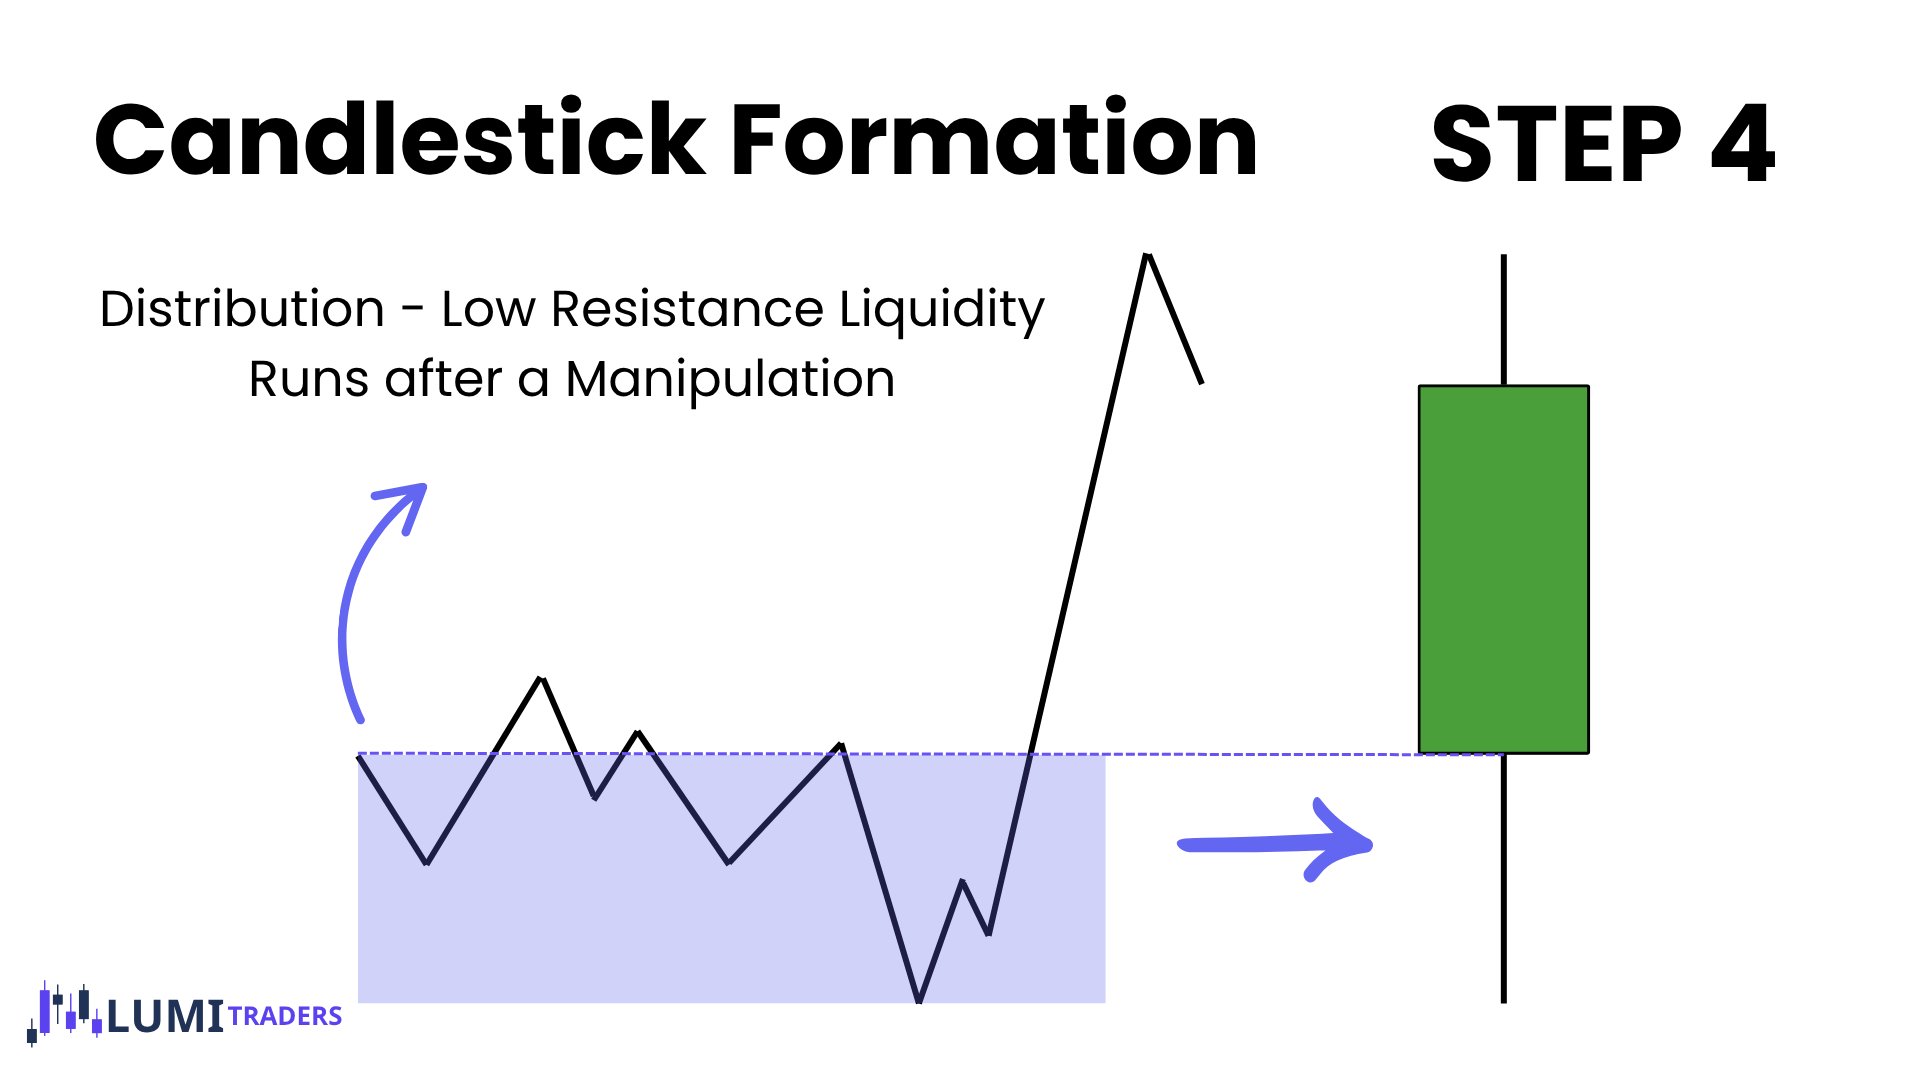
The Power of 3 is a concept that explains how price is often delivered during a specific period of time.
That period may be:
One daily candle
One four-hour candle
One hourly candle
One trading session
A smaller intraday range
How Can I Determine Whether a Candle Will Be Bullish or Bearish?
Example
Bearish Power of 3
Open–High–Low–Close
A bearish candle will form using the following sequence:
Open
High
Low
Close
This is known as Open–High–Low–Close, or OHLC.
Price opens, trades above the opening price to create the high, reverses lower, creates the low, and closes near the lower part of the candle.
The move above the opening price is often the manipulation.
The move lower is the distribution.
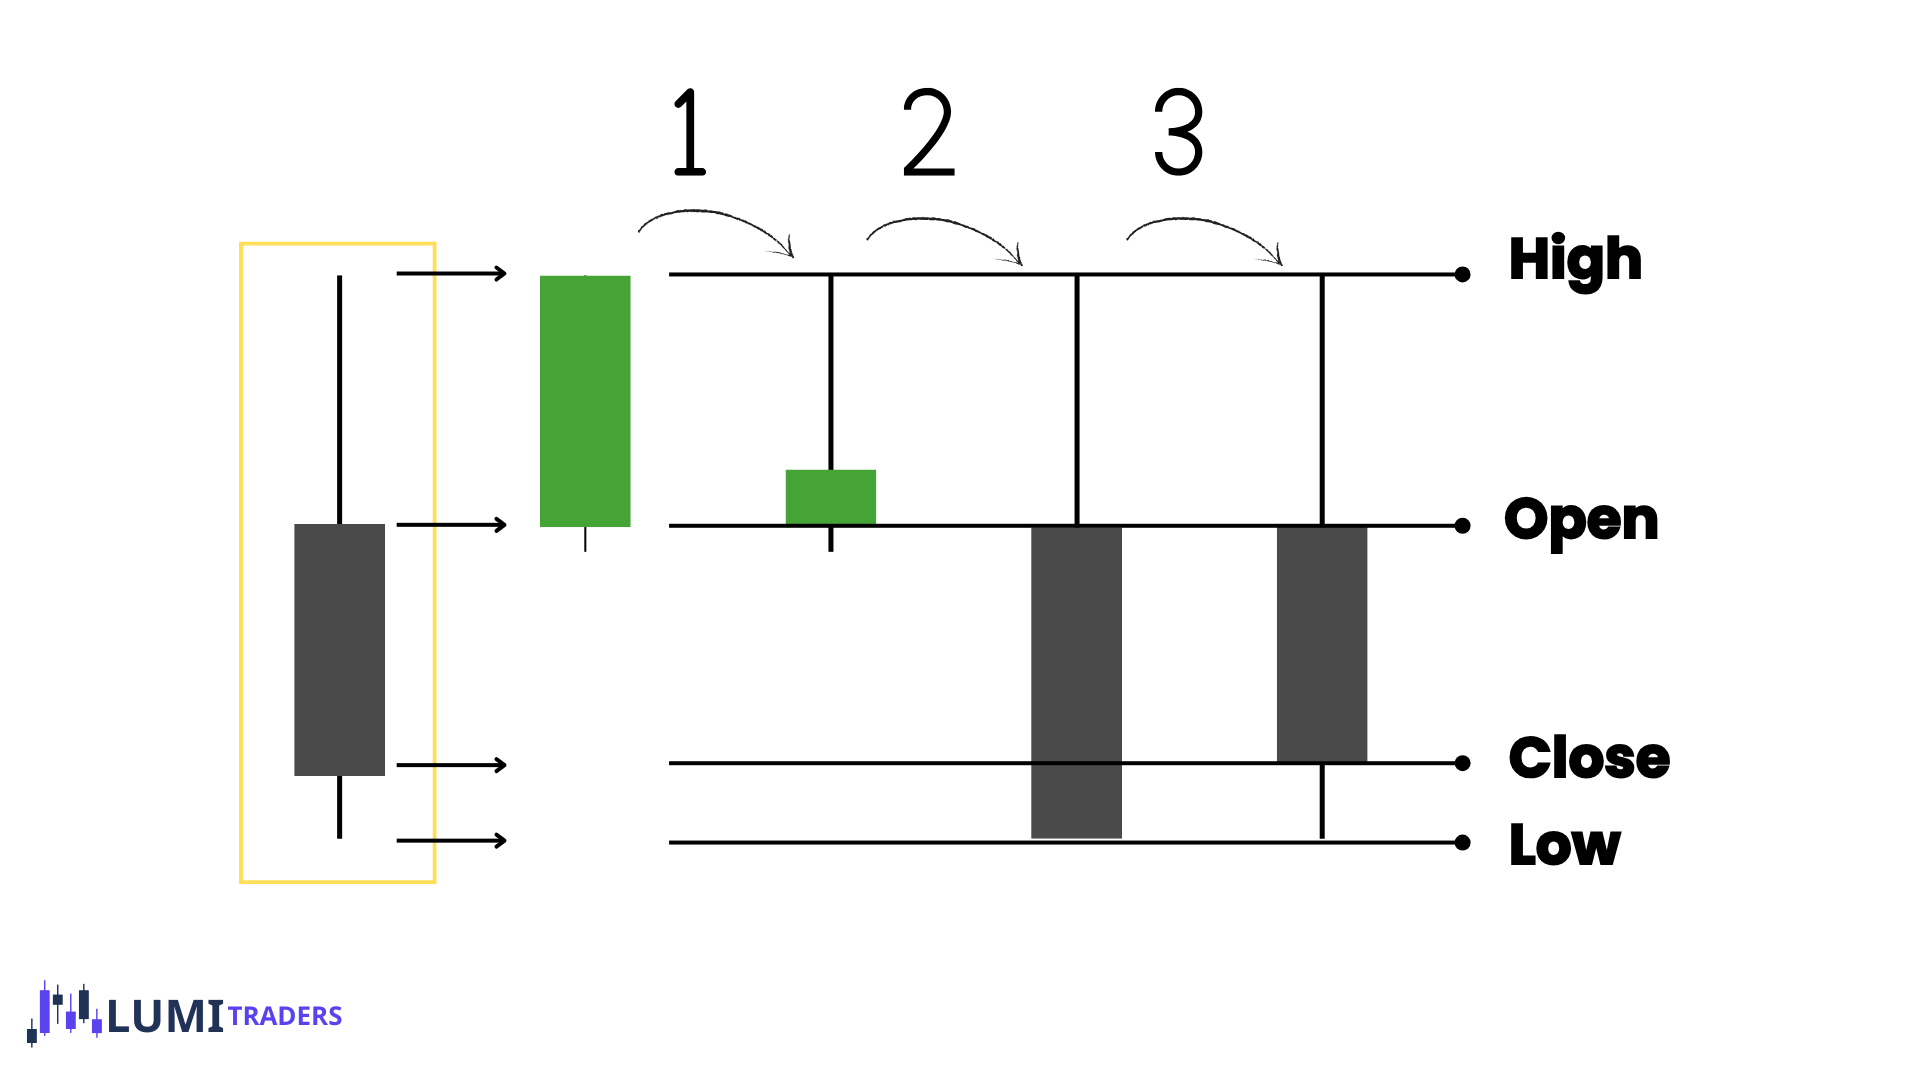
Bearish Power of 3 Formation
Imagine a new daily candle opens at 6 PM EST.
Price may initially consolidate near the daily opening price.
After accumulation, price trades above the daily open.
This move may take:
Buy-side liquidity.
The Asia high.
The London high.
A previous short-term high.
Equal highs.
An internal swing high.
Price may also reach a higher-timeframe bearish PD Array during this manipulation.
After taking liquidity, price creates bearish displacement and begins expanding lower.
The daily candle may create its high first, trade toward sell-side liquidity, and close bearish.
The complete sequence is:
Open → manipulation higher → high of the candle → bearish distribution → low → close
This creates an Open–High–Low–Close formation.
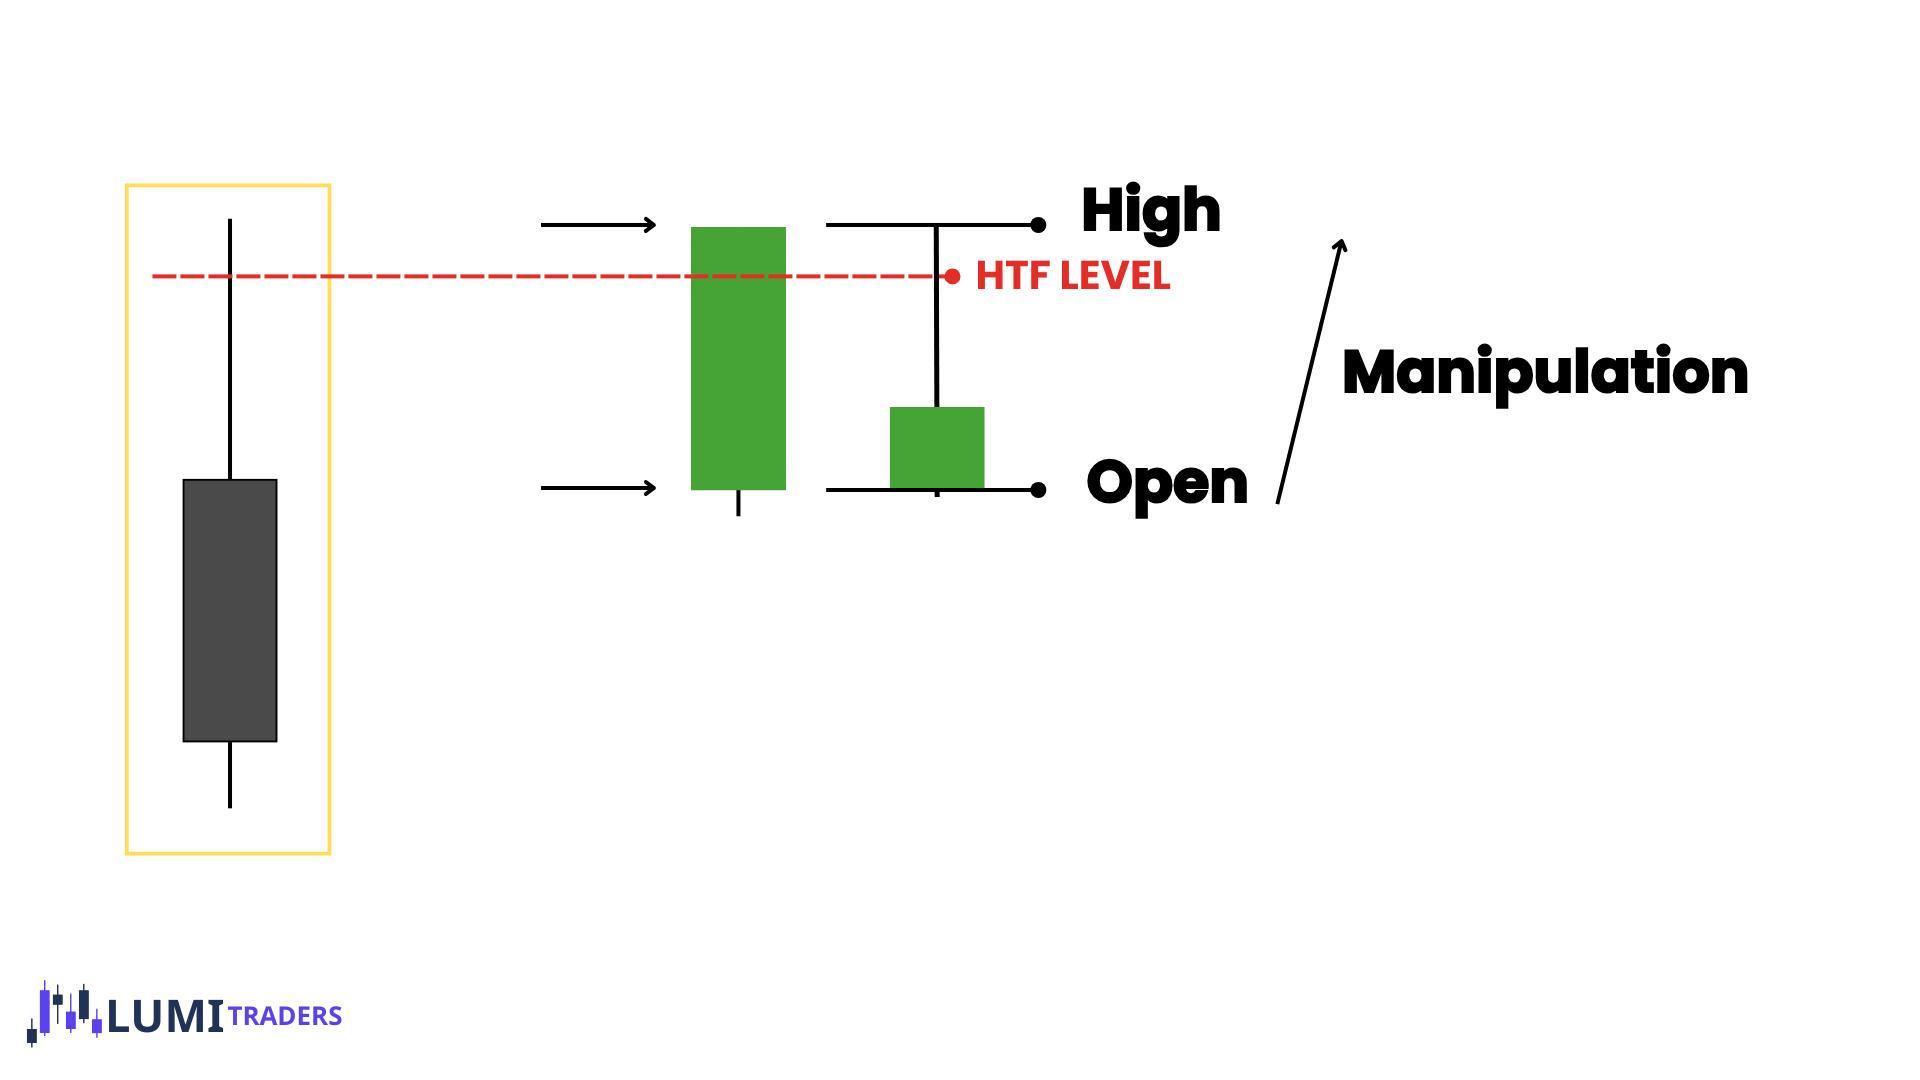
Bearish Distribution
After buy-side liquidity / HTF level is taken, price may begin its bearish distribution.
This move should ideally show:
Bearish displacement.
A break below a relevant swing low.
A change in the state of delivery.
A bearish fair value gap.
A bearish order block.
Acceptance below the opening price.
Continuation toward sell-side liquidity.
The manipulation creates the high of the candle, while the distribution creates the low.
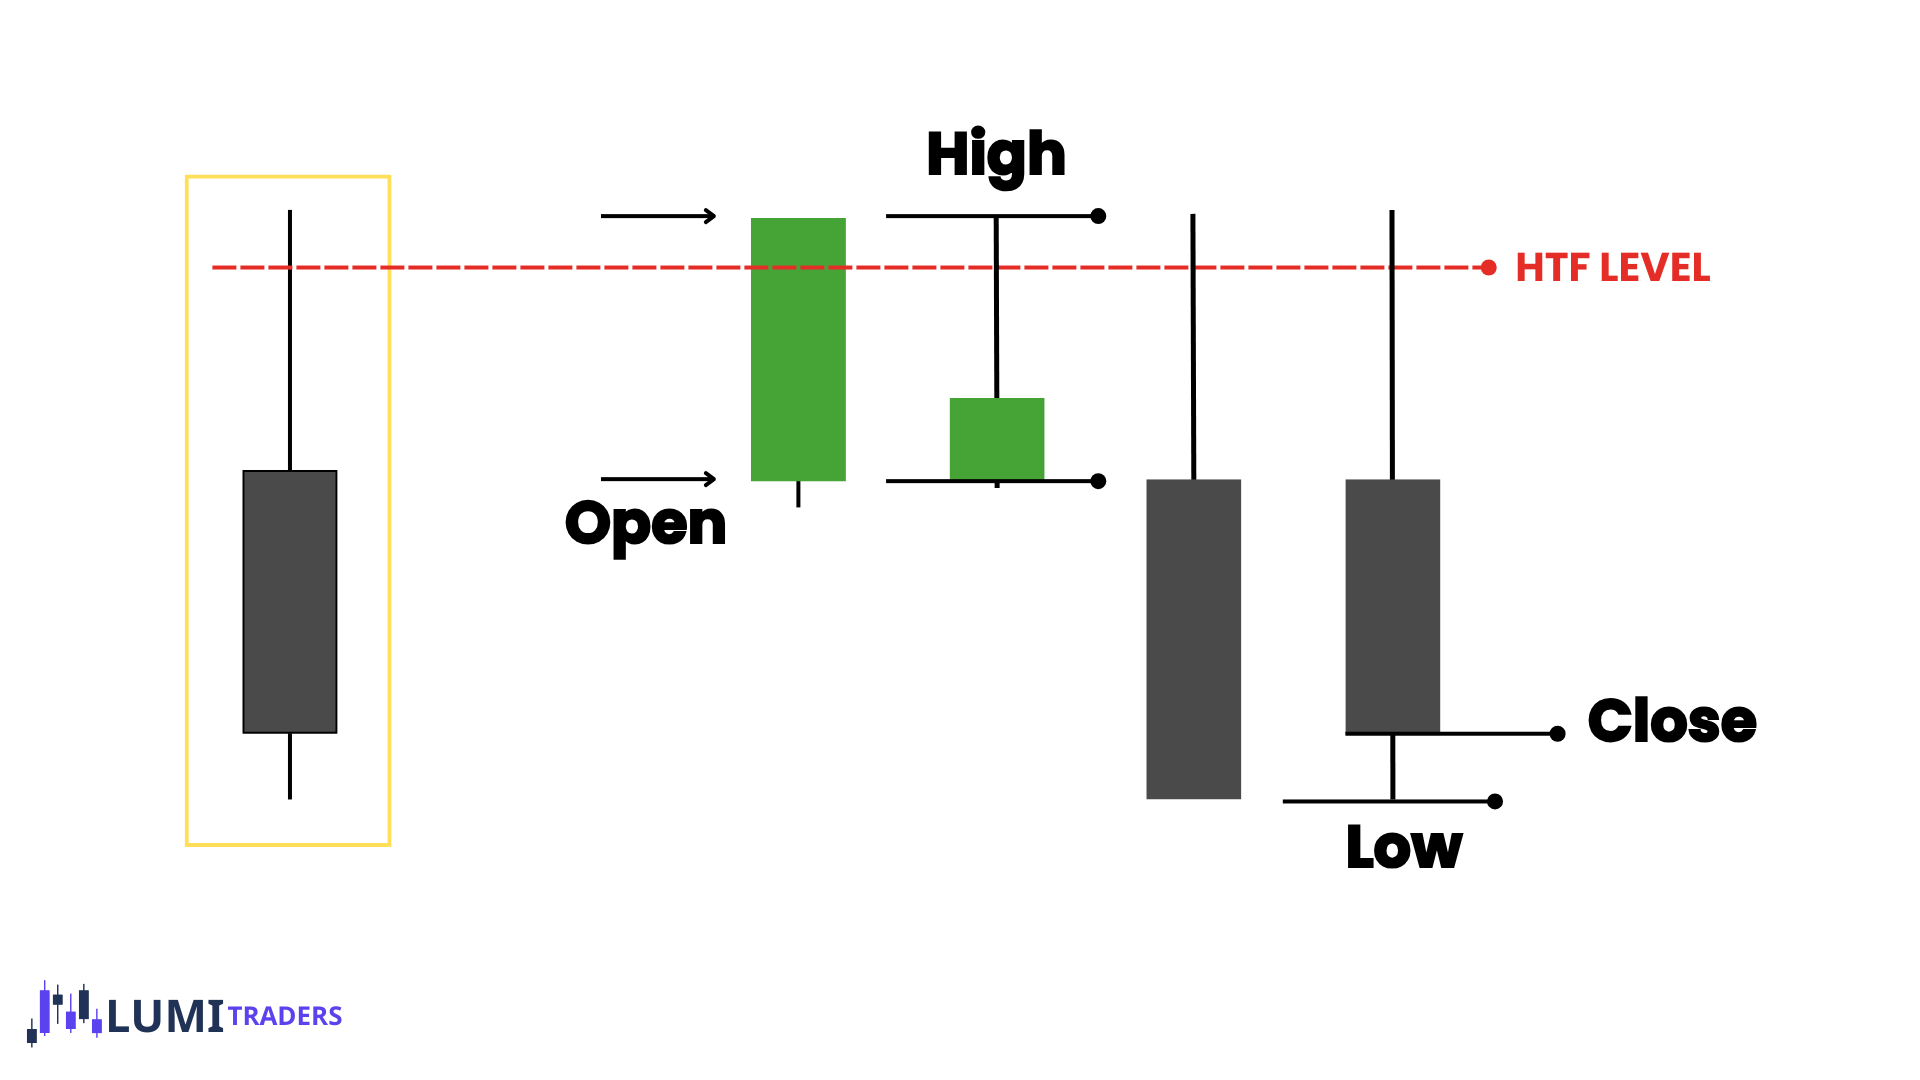
Why Is the Opening Price Important?
The opening price acts as a reference point for the entire candle or trading period.
It can help us understand:
Whether price is trading in premium or discount relative to the open.
Which side of the open may be used for manipulation.
Whether price is accepting above or below the open.
The likely direction of the candle’s body.
Whether the candle may close bullish or bearish.
For a bullish formation, we often want to see price manipulate below the opening price and later reclaim it.
For a bearish formation, we often want to see price manipulate above the opening price and later trade back below it.
The opening price is not an entry signal by itself.
It is a framework that helps us study how the candle is being formed.
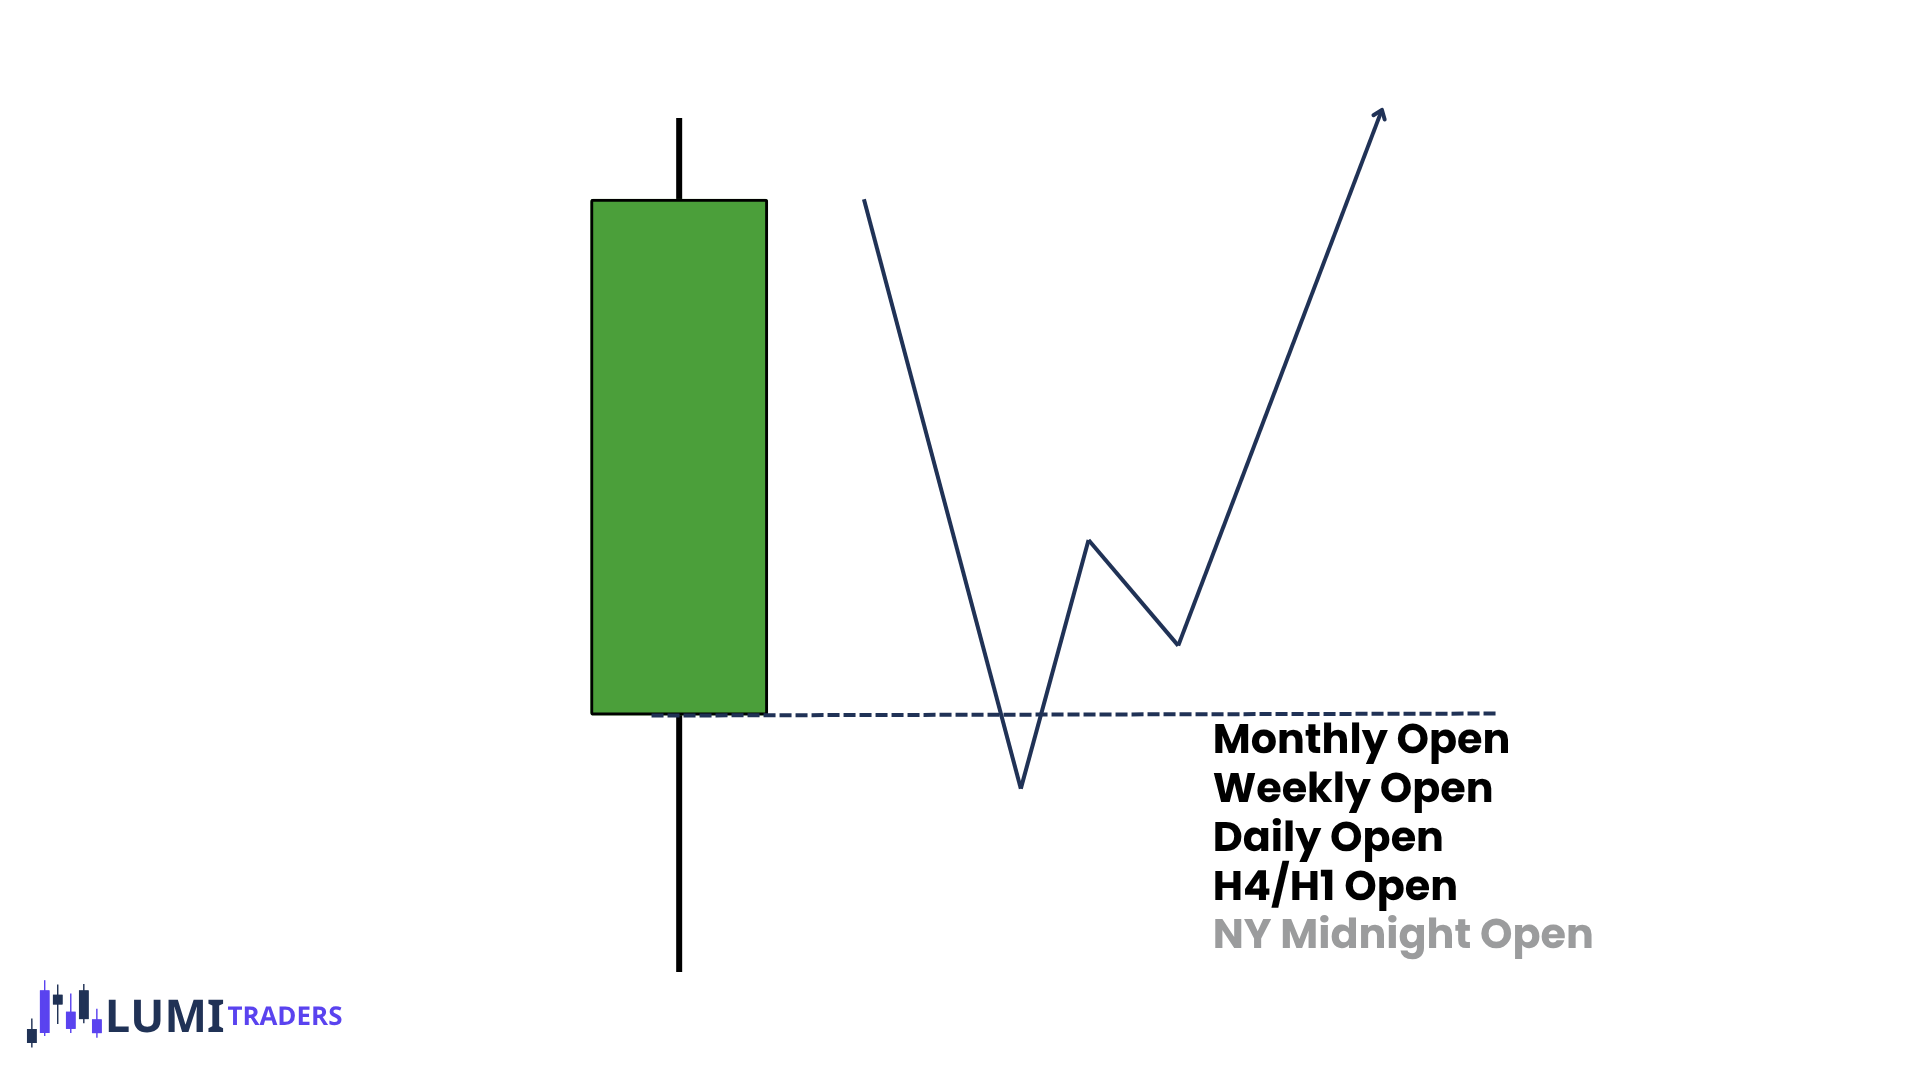
Once a candle opens:
Its high can continue moving higher.
Its low can continue moving lower.
Its closing price continues changing.
Its opening price never changes.
This gives us a stable level that separates bullish candle-body formation from bearish candle-body formation.
Why We Study Price Above or Below the Open
The opening price helps us answer an important question:
Is price forming a manipulation wick or beginning its real distribution?
For a bullish candle, price may initially trade below the open, create the low, reclaim the opening price, and then expand higher.
This creates an Open–Low–High–Close formation.
For a bearish candle, price may initially trade above the open, create the high, move back below the opening price, and then expand lower.
This creates an Open–High–Low–Close formation.
Therefore, we do not simply look at whether price is above or below an open.
We study how price arrived there.
Ask:
Was liquidity taken first?
Did price reach a higher-timeframe PD Array?
Did displacement occur?
Was a relevant swing point broken?
Did price close above or below the open?
Is price holding the open during a retracement?
What is the next draw on liquidity?
Why We Prefer Longs Above an Opening Price and Short Below an Opening Price
When price breaks above an important opening price and holds above it, the market is showing bullish signature. It shows that low of the current candle most likely was drawn!
This means price is beginning to build the candle body above its open.
A high-probability bullish sequence may look like this:
Price trades below the opening price.
Sell-side liquidity/HTF level is taken.
Price reaches a bullish PD Array.
Bullish displacement appears.
Price closes above the opening price.
A retracement respects the open or a bullish PD Array above it.
Price continues toward buy-side liquidity/HTF level.
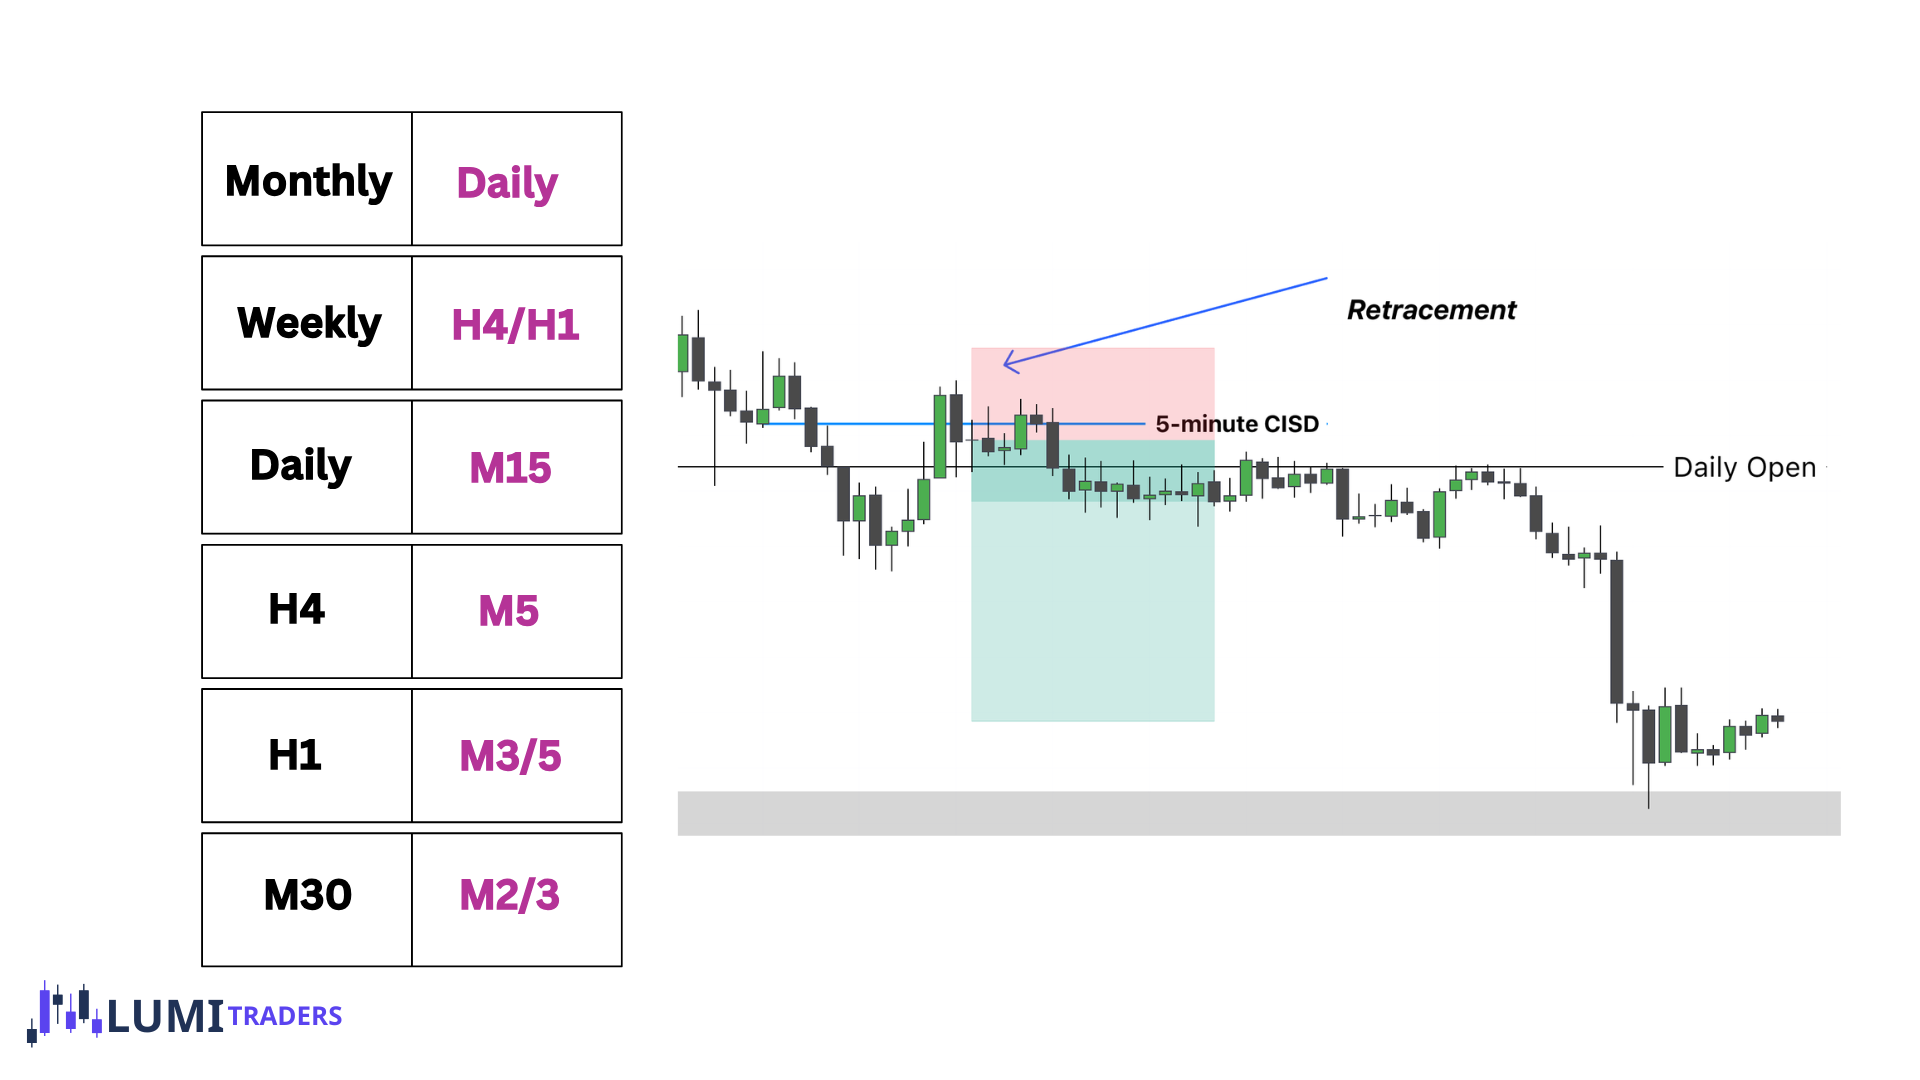
To trade this phase, we will use the Timeframe Alignment Chart.
Example
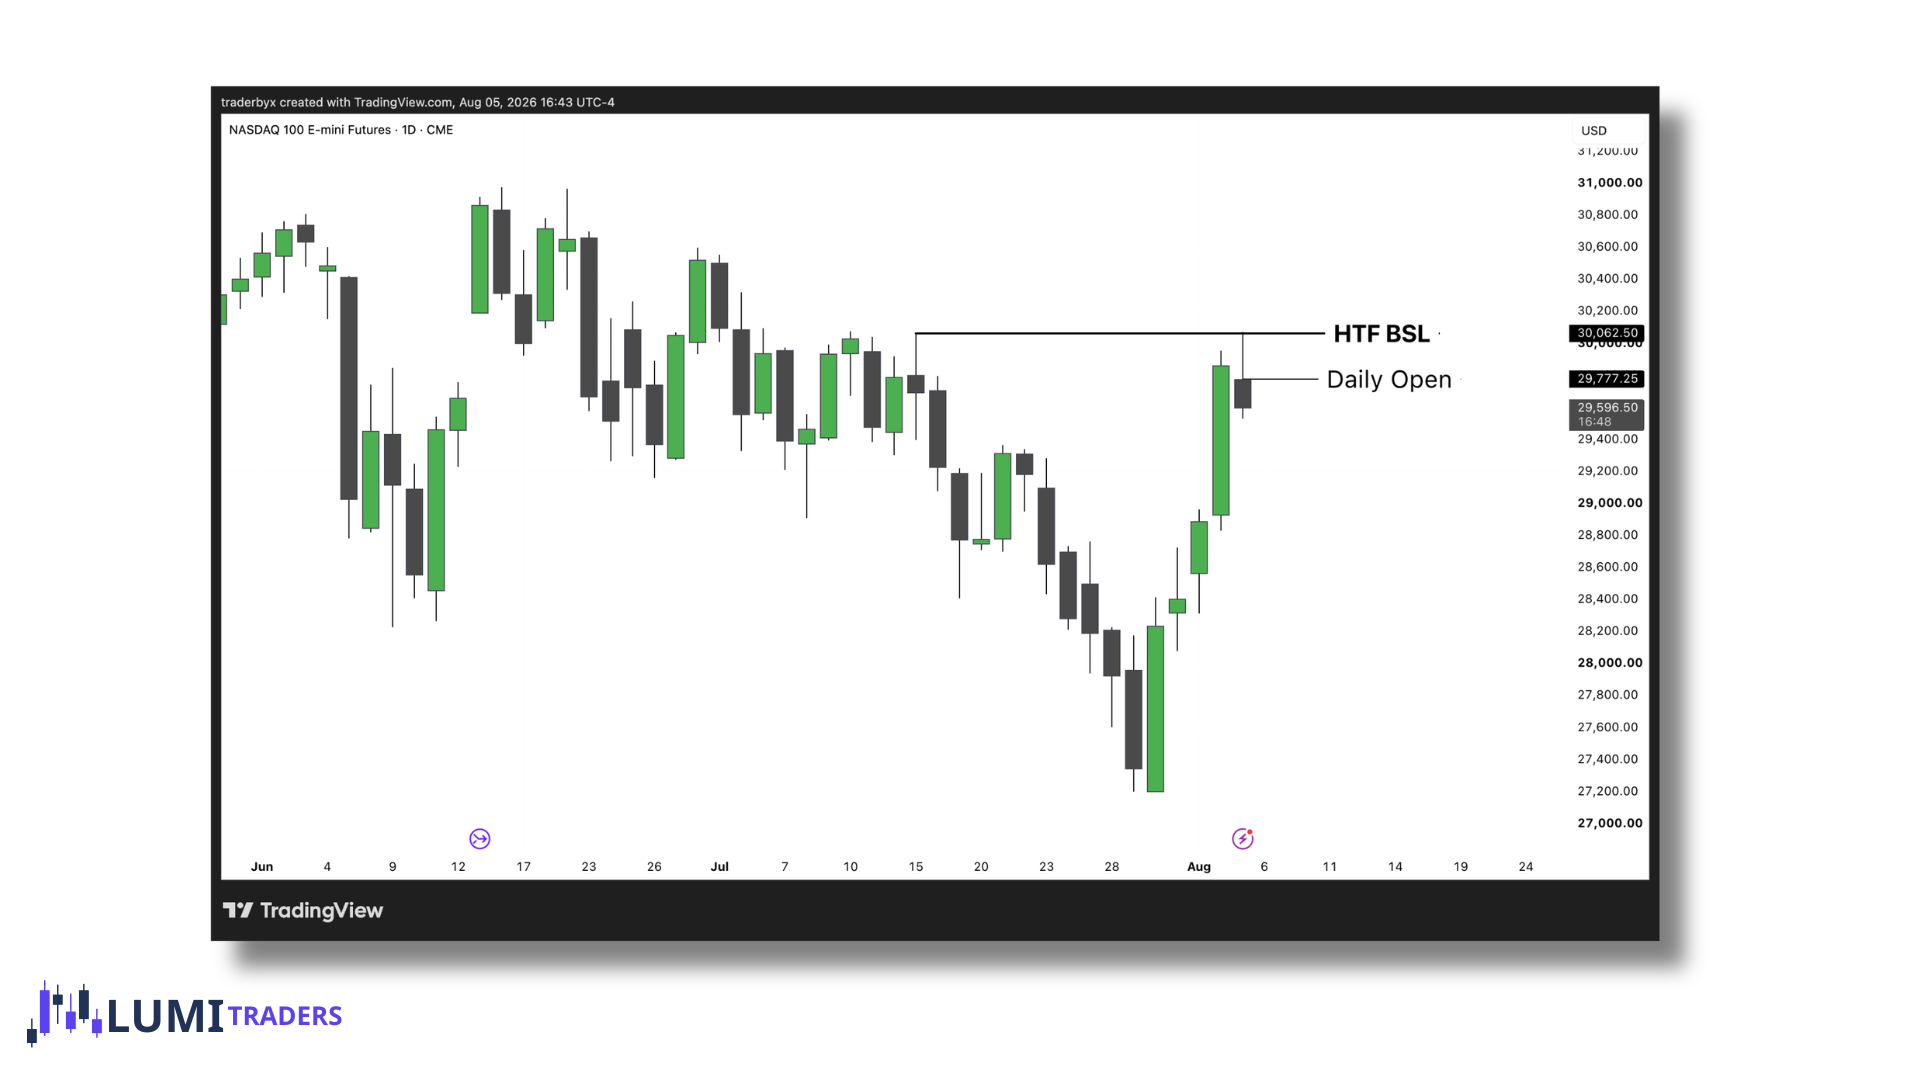
$NQ reached BSL and produced a clear reaction.
Example
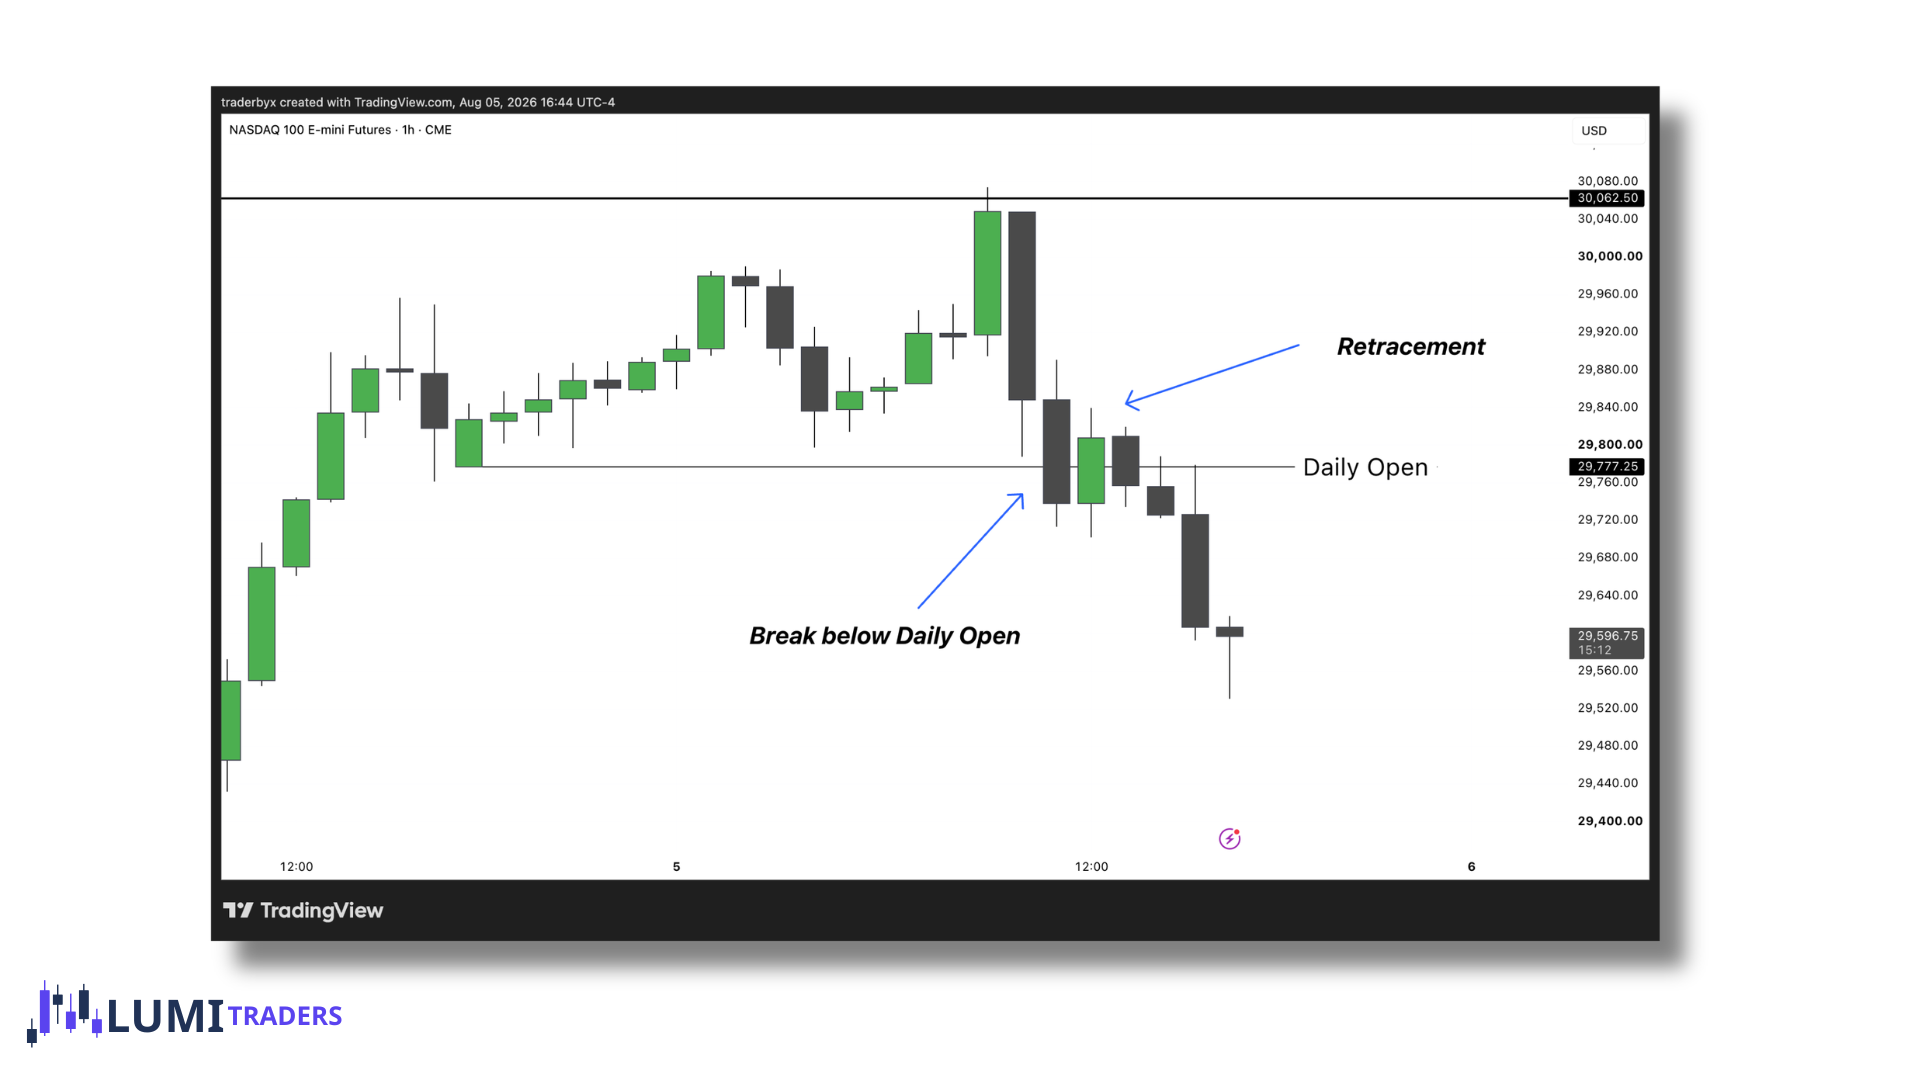
Using the Timeframe Alignment Chart,, we want to switch on 1-hour chart and use the Daily Open to determine whether the daily candle is likely to be bullish or bearish. For this reason, we want to observe how price reacts around the Daily Open. As we can see here, price reached BSL and then closed below the Daily Open on the one-hour chart. This gives us an indication that the high of the daily candle may already be in.
Example
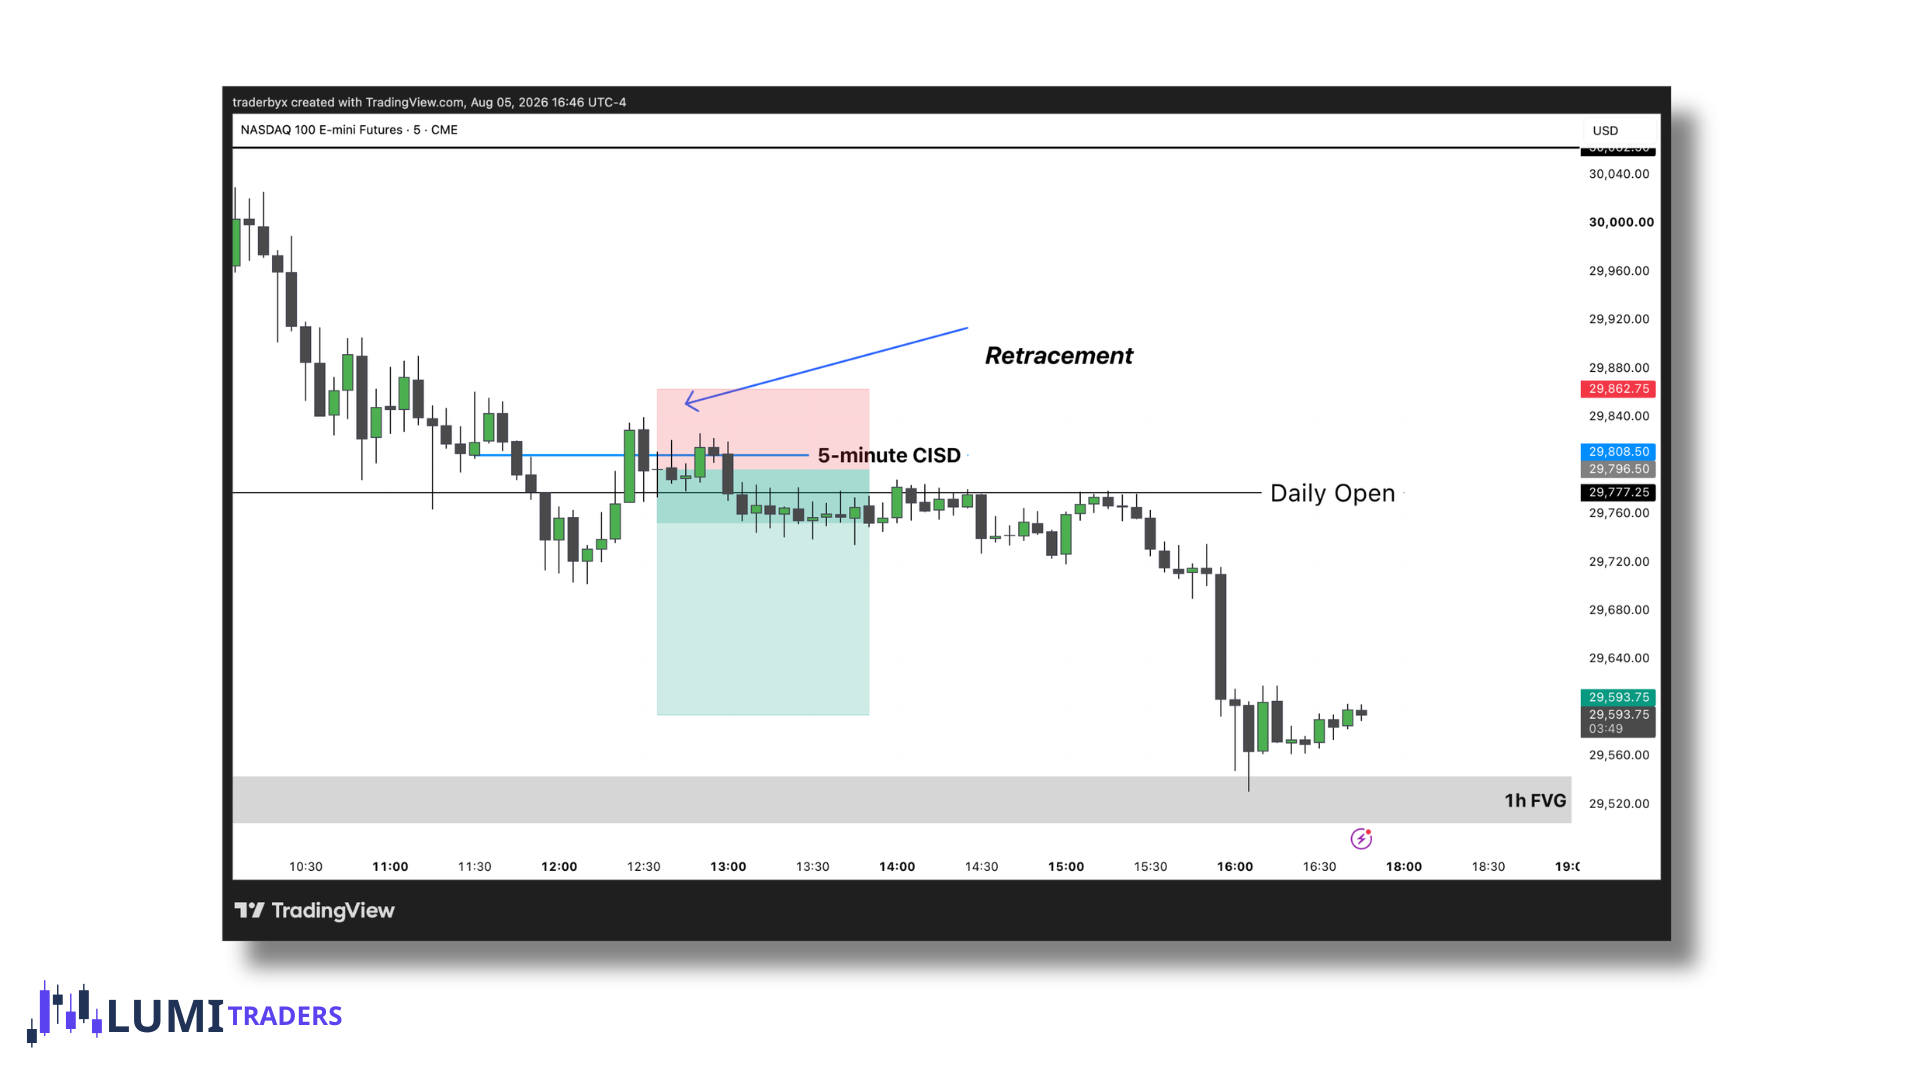
Since we are intraday traders, we want to move to a lower timeframe and find the best possible entry targeting a higher-timeframe level or sell-side liquidity (SSL).
Using the Timeframe Alignment Chart, we align the one-hour chart with the five-minute chart to find a more precise entry with better risk-to-reward.
As we can see, after the one-hour candle closed below the Daily Open, the next candle began to retrace. On the five-minute chart, this retracement delivered price directly into a five-minute Order Block, where we received a clear reaction.
We enter at the open of the next five-minute candle, place the stop loss above the nearest swing high, and target the higher-timeframe level or SSL.
The move above the open may have created the upper wick or manipulation phase.
The break below the open suggests that bearish distribution is beginning.
This is why we often prefer shorts after price breaks and holds below an important opening price.
We are waiting for sellers to prove that price can move below the level and begin forming a bearish candle body.
A Break Is Not Enough
Price can cross an opening price many times during consolidation.
Therefore, a small wick above or below the open should not automatically be treated as confirmation.
We want to see a signature.
Bullish signature may include:
Displacement above the open.
A candle body closing above the open.
A break of a relevant swing high.
A bullish FVG/OB.
A retracement that holds above the open.
Continuation toward buy-side liquidity/HTF level.
Bearish signature may include:
Displacement below the open.
A candle body closing below the open.
A break of a relevant swing low.
A bearish FVG/OB
A retracement that stays below the open.
Continuation toward sell-side liquidity/HTF level.
The stronger the displacement and the cleaner the hold, the more meaningful the break becomes.
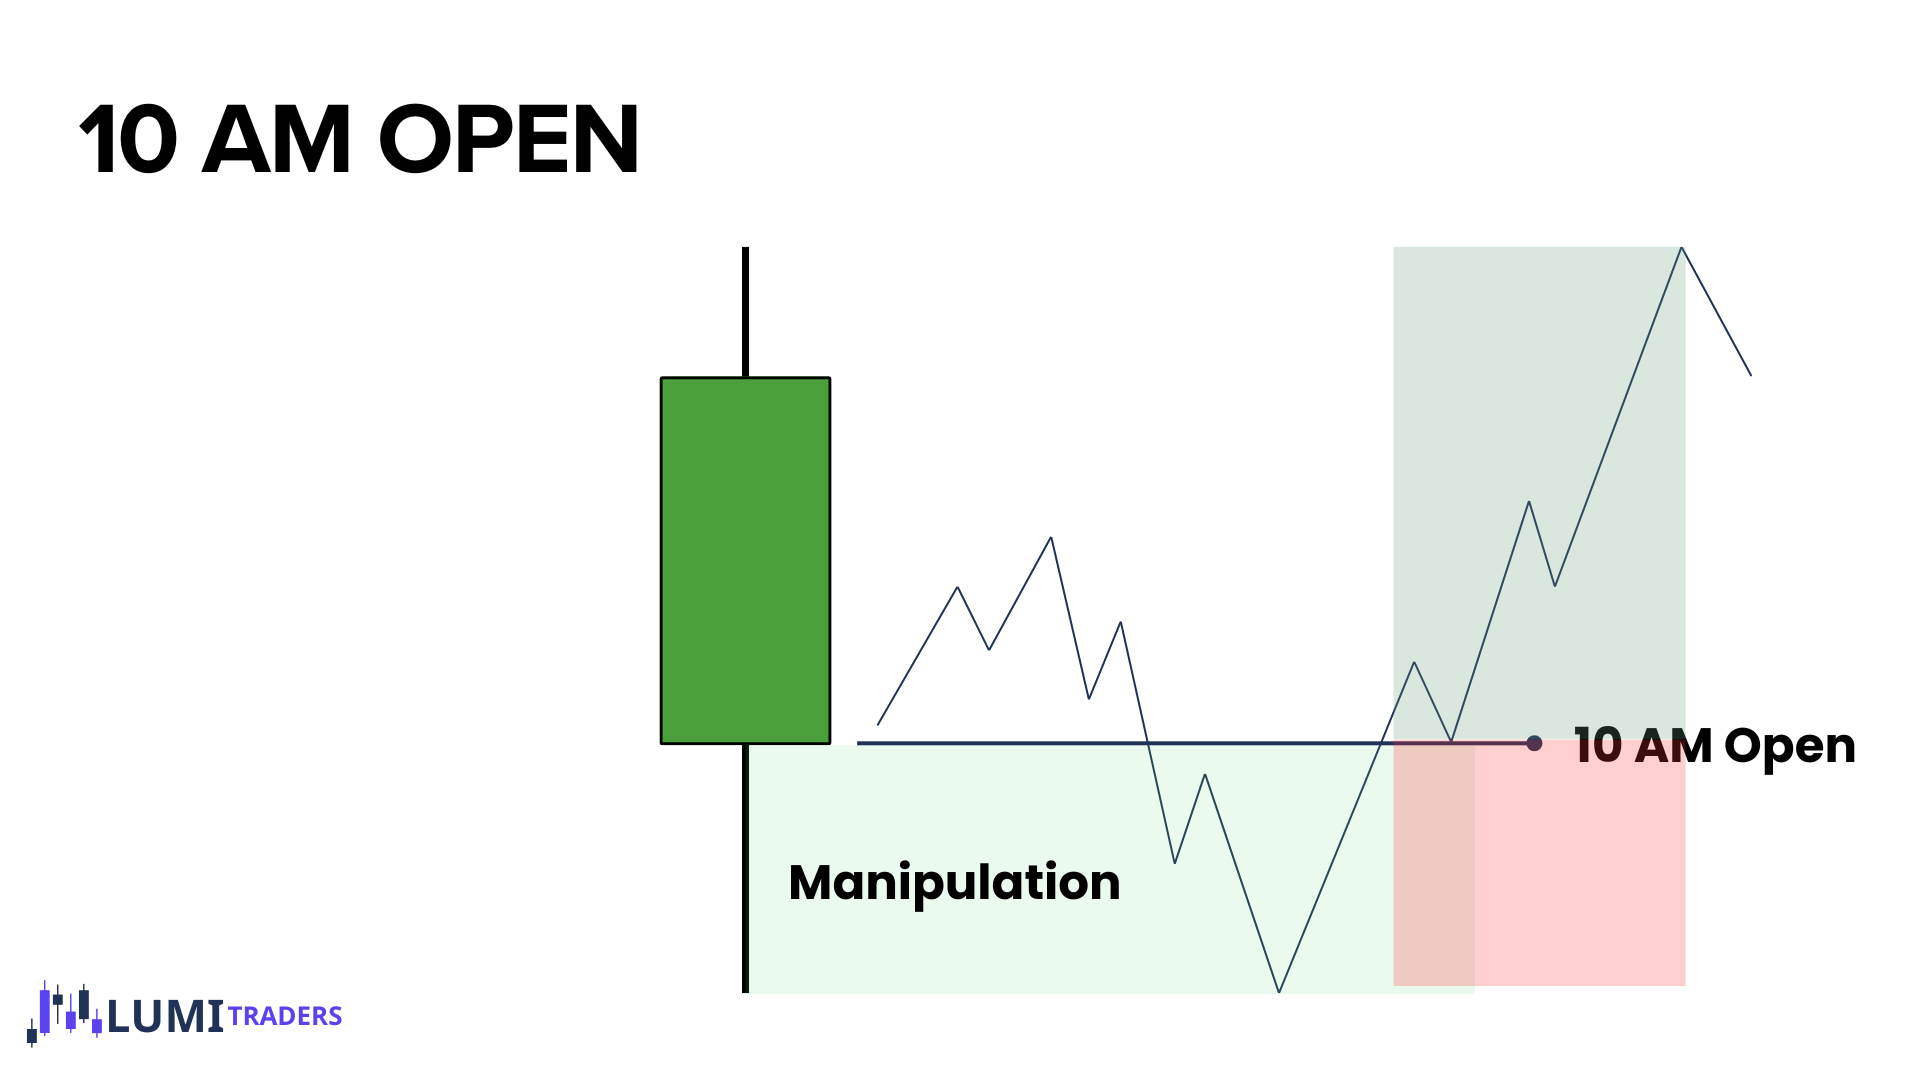
10 AM Open
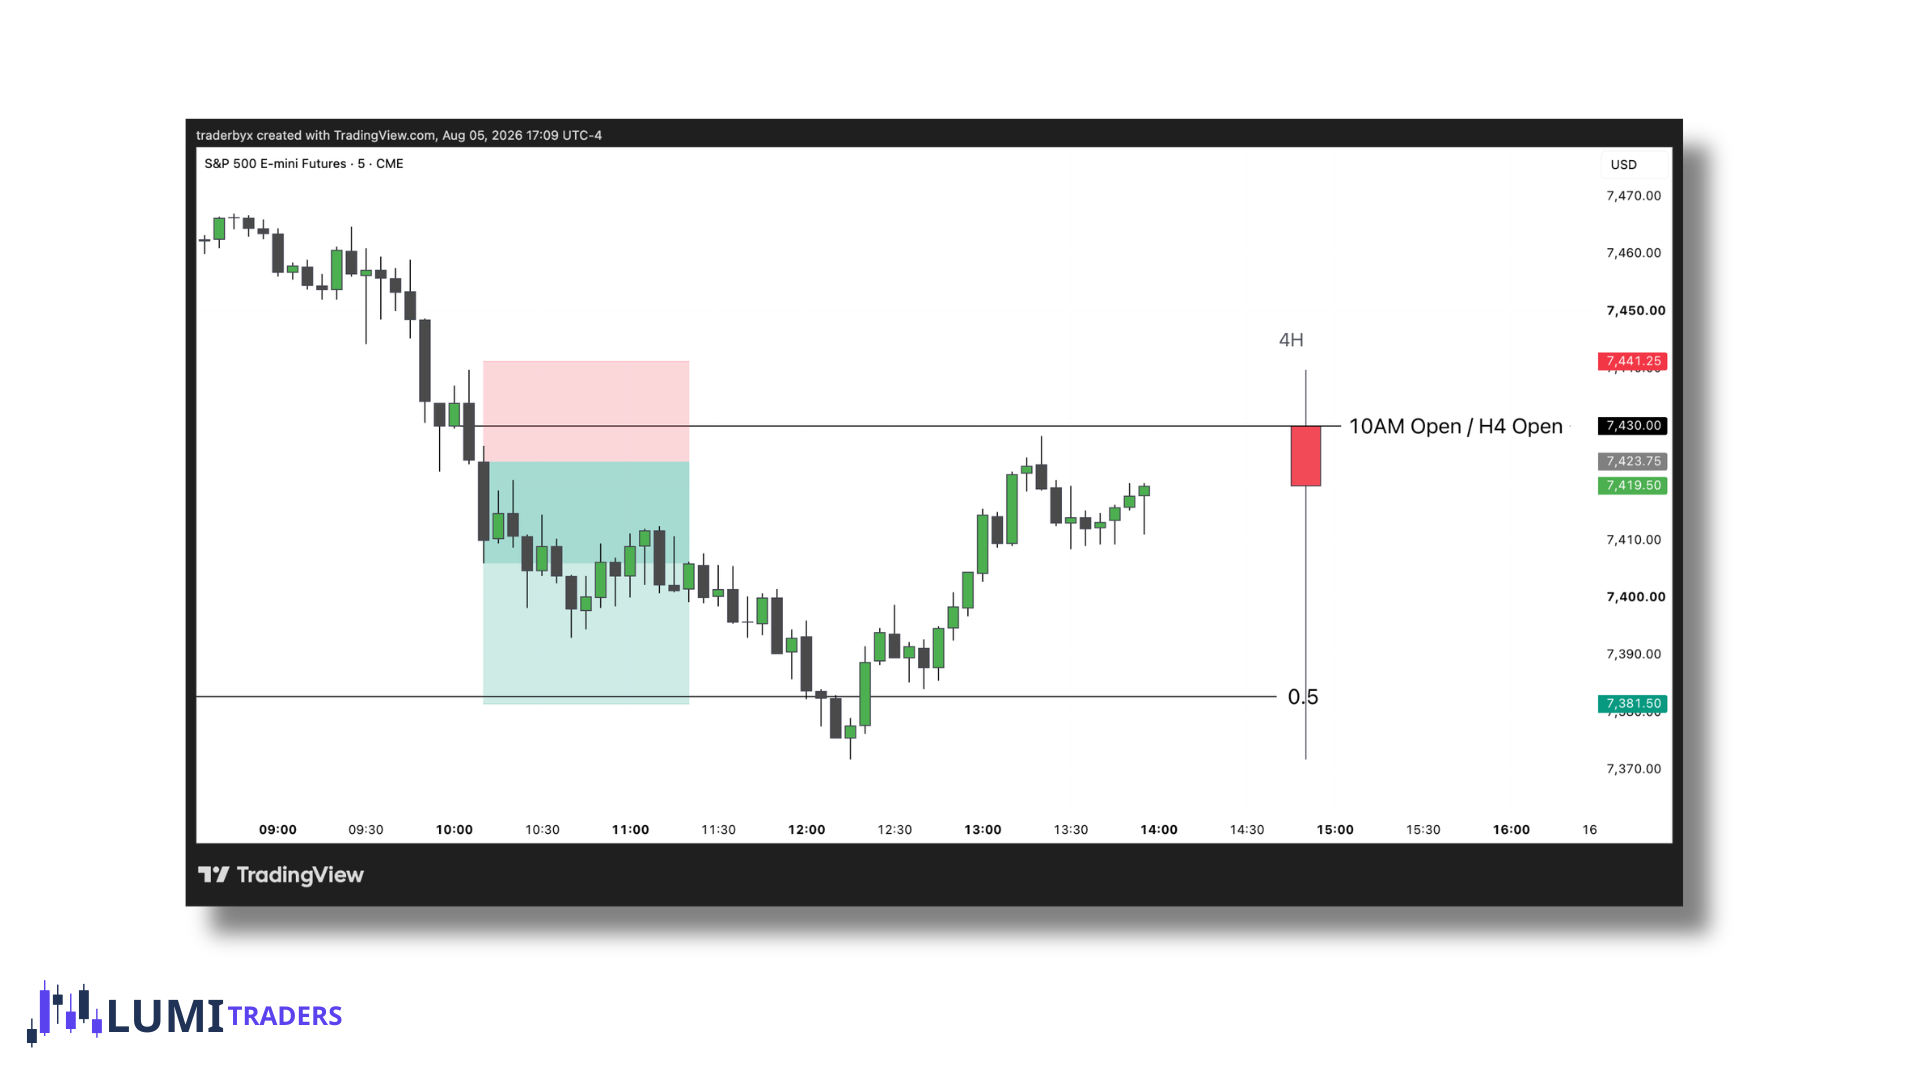
The 10:00 AM Open is one of the most important intraday reference levels for New York session traders.
The 10:00 AM Open is important because it represents the opening price of a new four-hour candle.
Once the new four-hour candle opens, we want to observe how price trades around this level because the market may begin forming:
The manipulation wick.
The body of the four-hour candle.
The next stage of distribution.
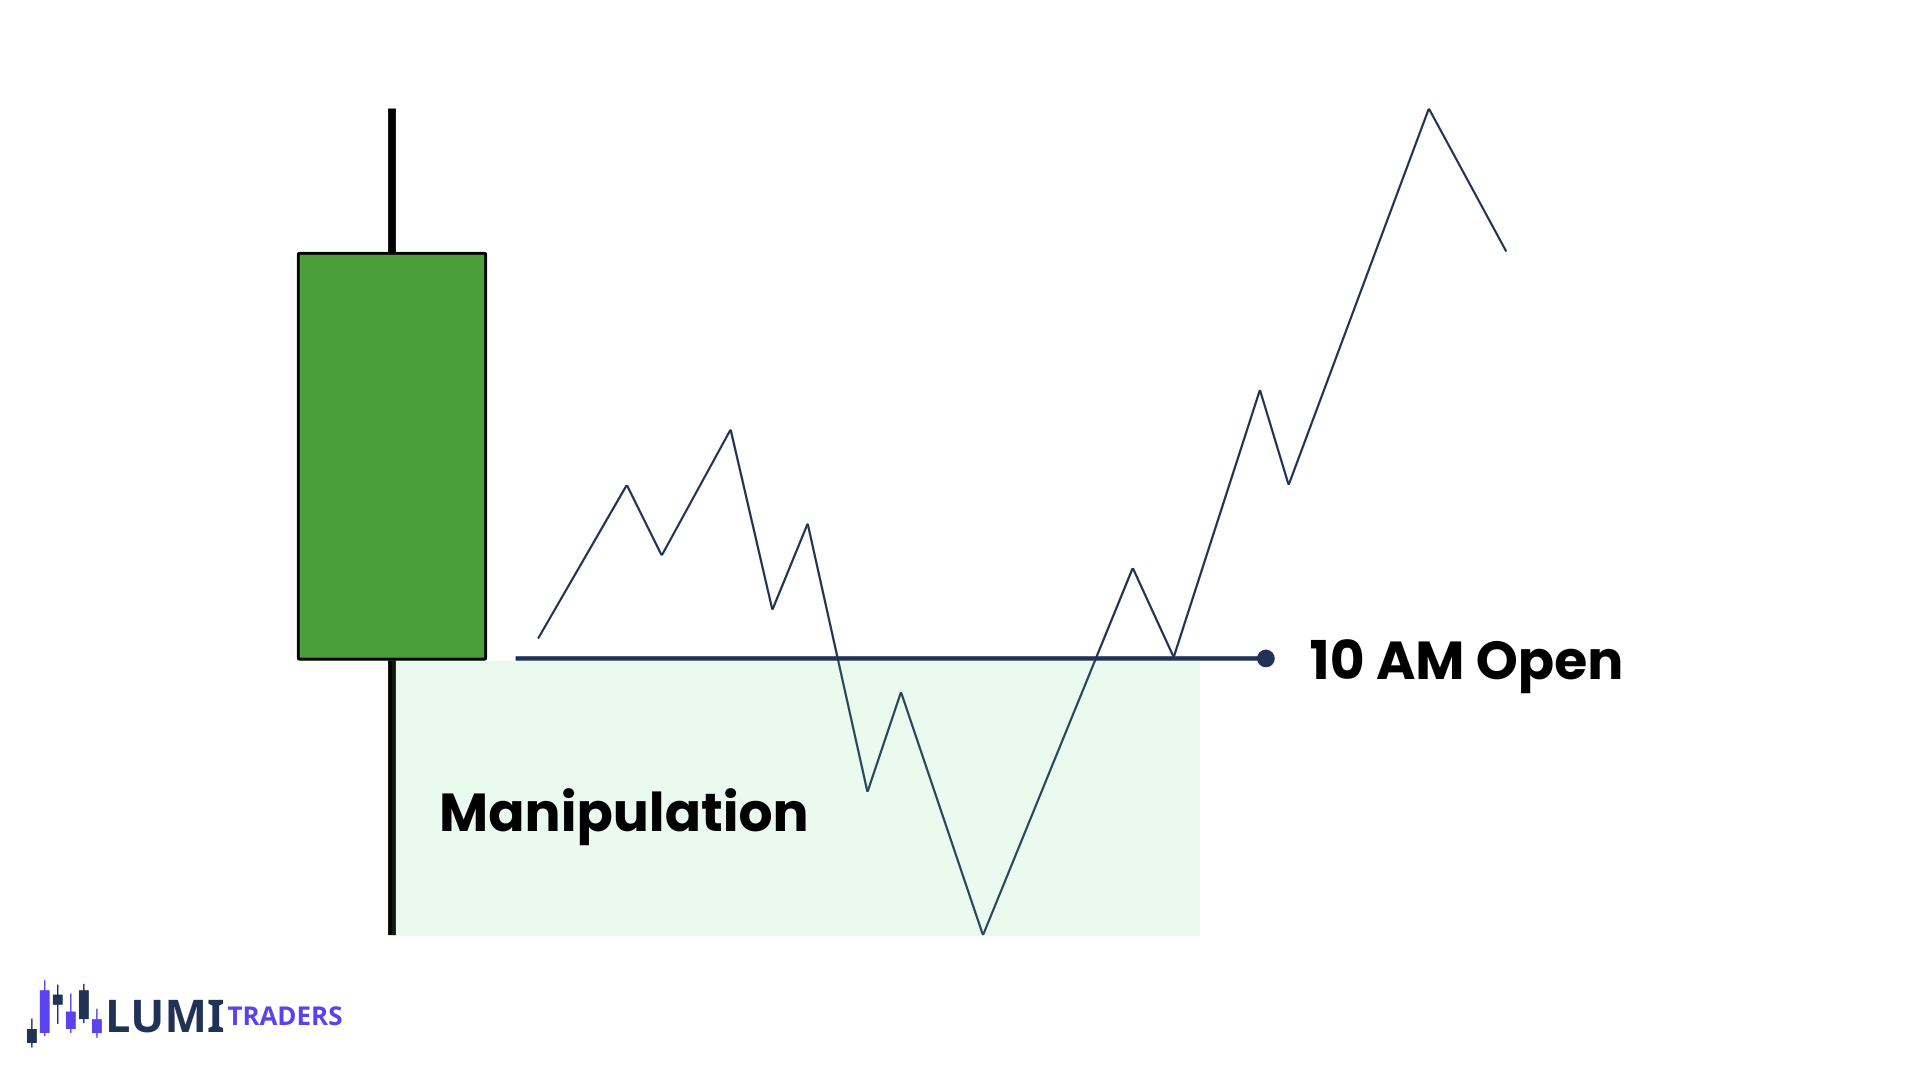
When we expect the new 4-hour candle to form bullish, we anticipate an:
Open–Low–High–Close formation.
After the candle opens at 10:00 AM, price may initially trade below the 10:00 AM Open.
If the draw on liquidity remains higher, we want to see a minor pullback below the 10:00 AM Open into internal sell-side liquidity, an untapped Order Block, or an FVG.
Once price reclaims and breaks back above the 10:00 AM Open, it signals that the manipulation may be complete and price is ready to begin forming the body of the new four-hour candle.
Wick Through the Open Is Not Enough
Price may cross the 10:00 AM Open several times while accumulating.
A small wick above or below the open does not confirm body formation.
For bullish confirmation, we ideally want:
Bullish displacement through the open.
A two-minute candle-body closure above the open.
A bullish FVG or CISD.
Price holding above the open during a retracement.
For bearish confirmation, we ideally want:
Bearish displacement through the open.
A two-minute candle-body closure below the open.
A bearish FVG or CISD.
Price remaining below the open during a retracement.
The goal is not simply to see price cross the level.
The goal is to see acceptance and body formation on one side of the open.
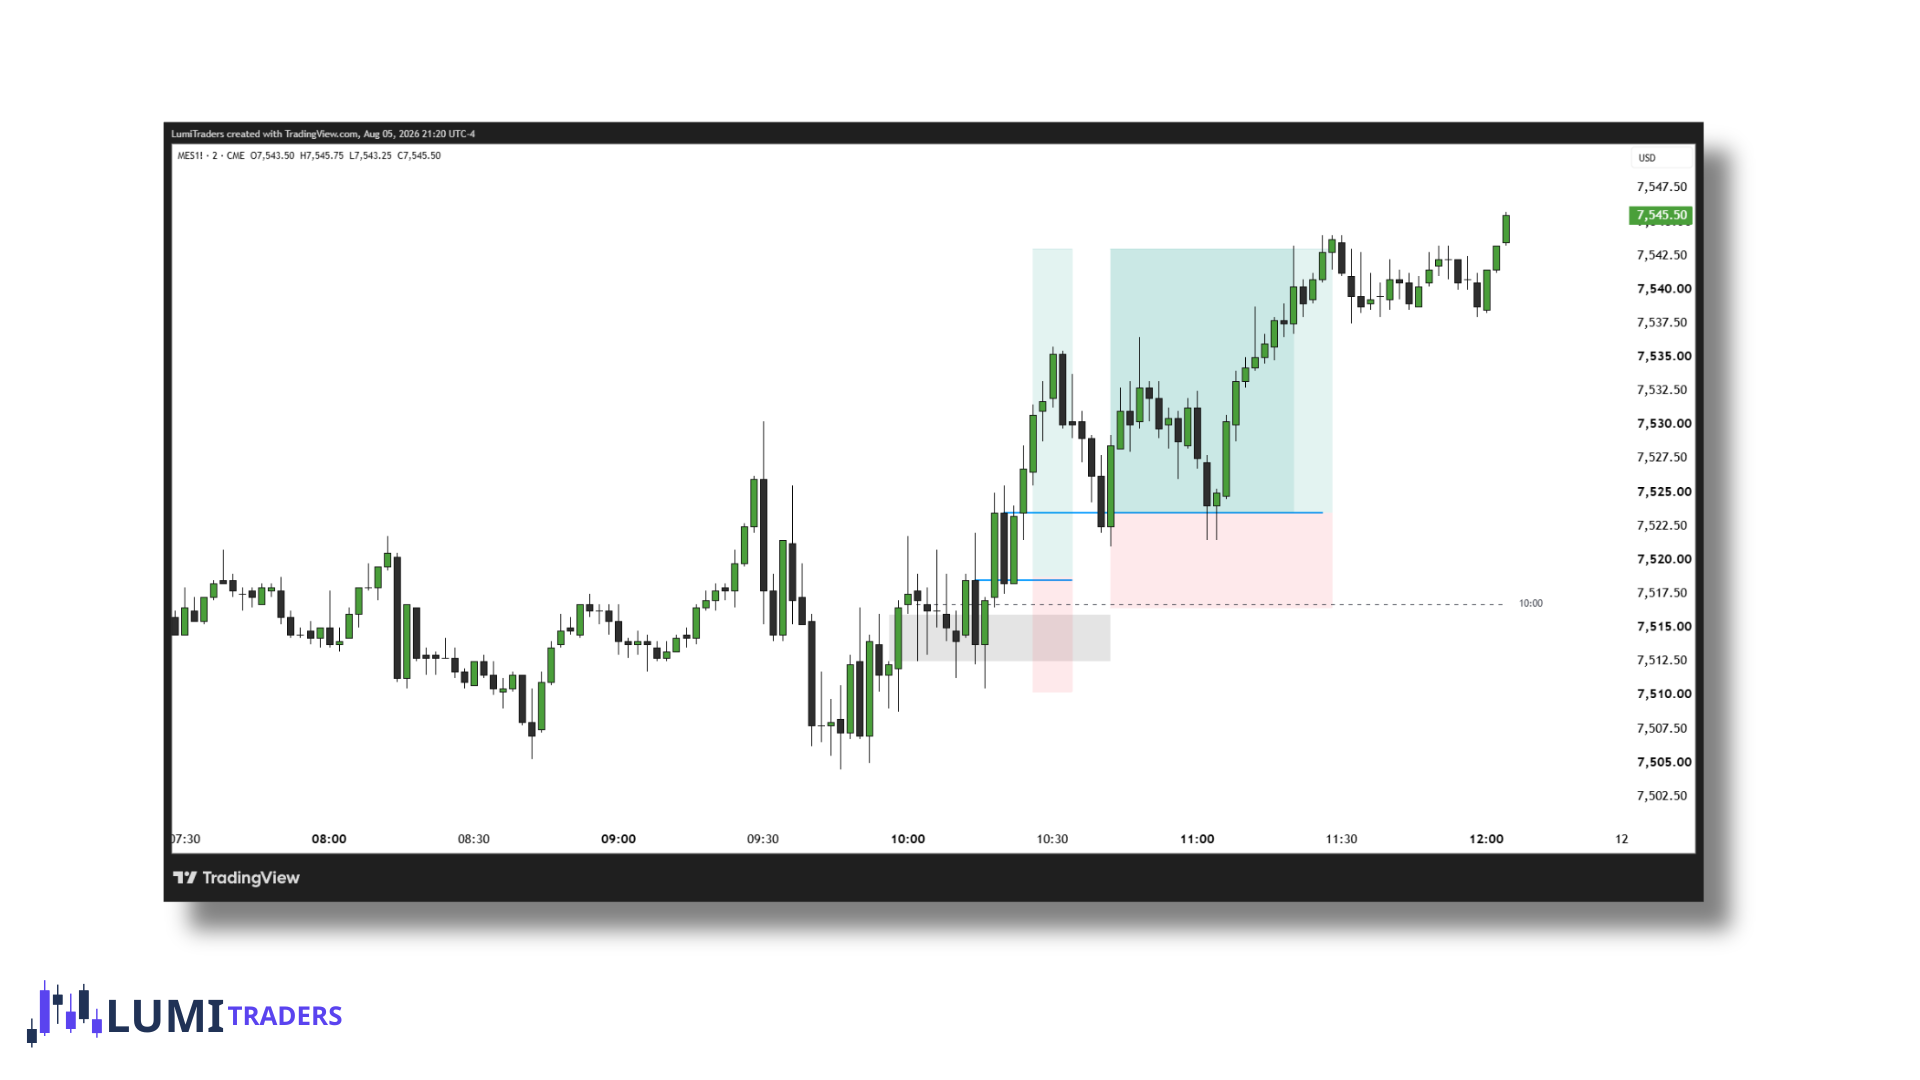
Example
Bullish Two-Minute Playbook
Narrative
We expect the new 4-hour candle to form bullish.
Our anticipated formation is:
Open–Low–High–Close
Price may manipulate below the 10:00 AM Open, create the candle low, and then break above the open to begin bullish body formation.
Conditions
Before considering a long, we want to see:
A bullish higher-timeframe objective.
Buy-side liquidity available above price.
Price trading below or around the 10:00 AM Open.
Sell-side liquidity/internal PDA taken below the open.
A reaction from a bullish PD Array, discount area, or relevant support.
Bullish displacement on the 2-minute chart.
A break and candle-body close above the 10:00 AM Open.
A bullish entry array forming above or near the open.
Entry
After price closes above the 10:00 AM Open, wait for a retracement into one of the following:
Two-minute bullish order block.
Two-minute bullish fair value gap.
Two-minute breaker.
A combination of the opening price and a bullish PD Array.
Enter only if price continues respecting the 10:00 AM Open or quickly reclaims it after a shallow retest.
Stop Loss
Place the stop below the level that invalidates the bullish narrative.
This may be:
Below the two-minute protected low.
Below the manipulation low.
Below the bullish order block.
Below the swing that created displacement.
Do not automatically place the stop one tick below the 10:00 AM Open.
The open is the directional filter, not necessarily the invalidation point.
Targets
Potential bullish targets include:
A short-term two-minute swing high.
The morning high.
The London high.
Premarket buy-side liquidity.
The previous day high.
Equal highs.
A higher-timeframe bearish PD Array.
External buy-side liquidity.
The final target should be based on the higher-timeframe draw on liquidity.
NY Midnight Open
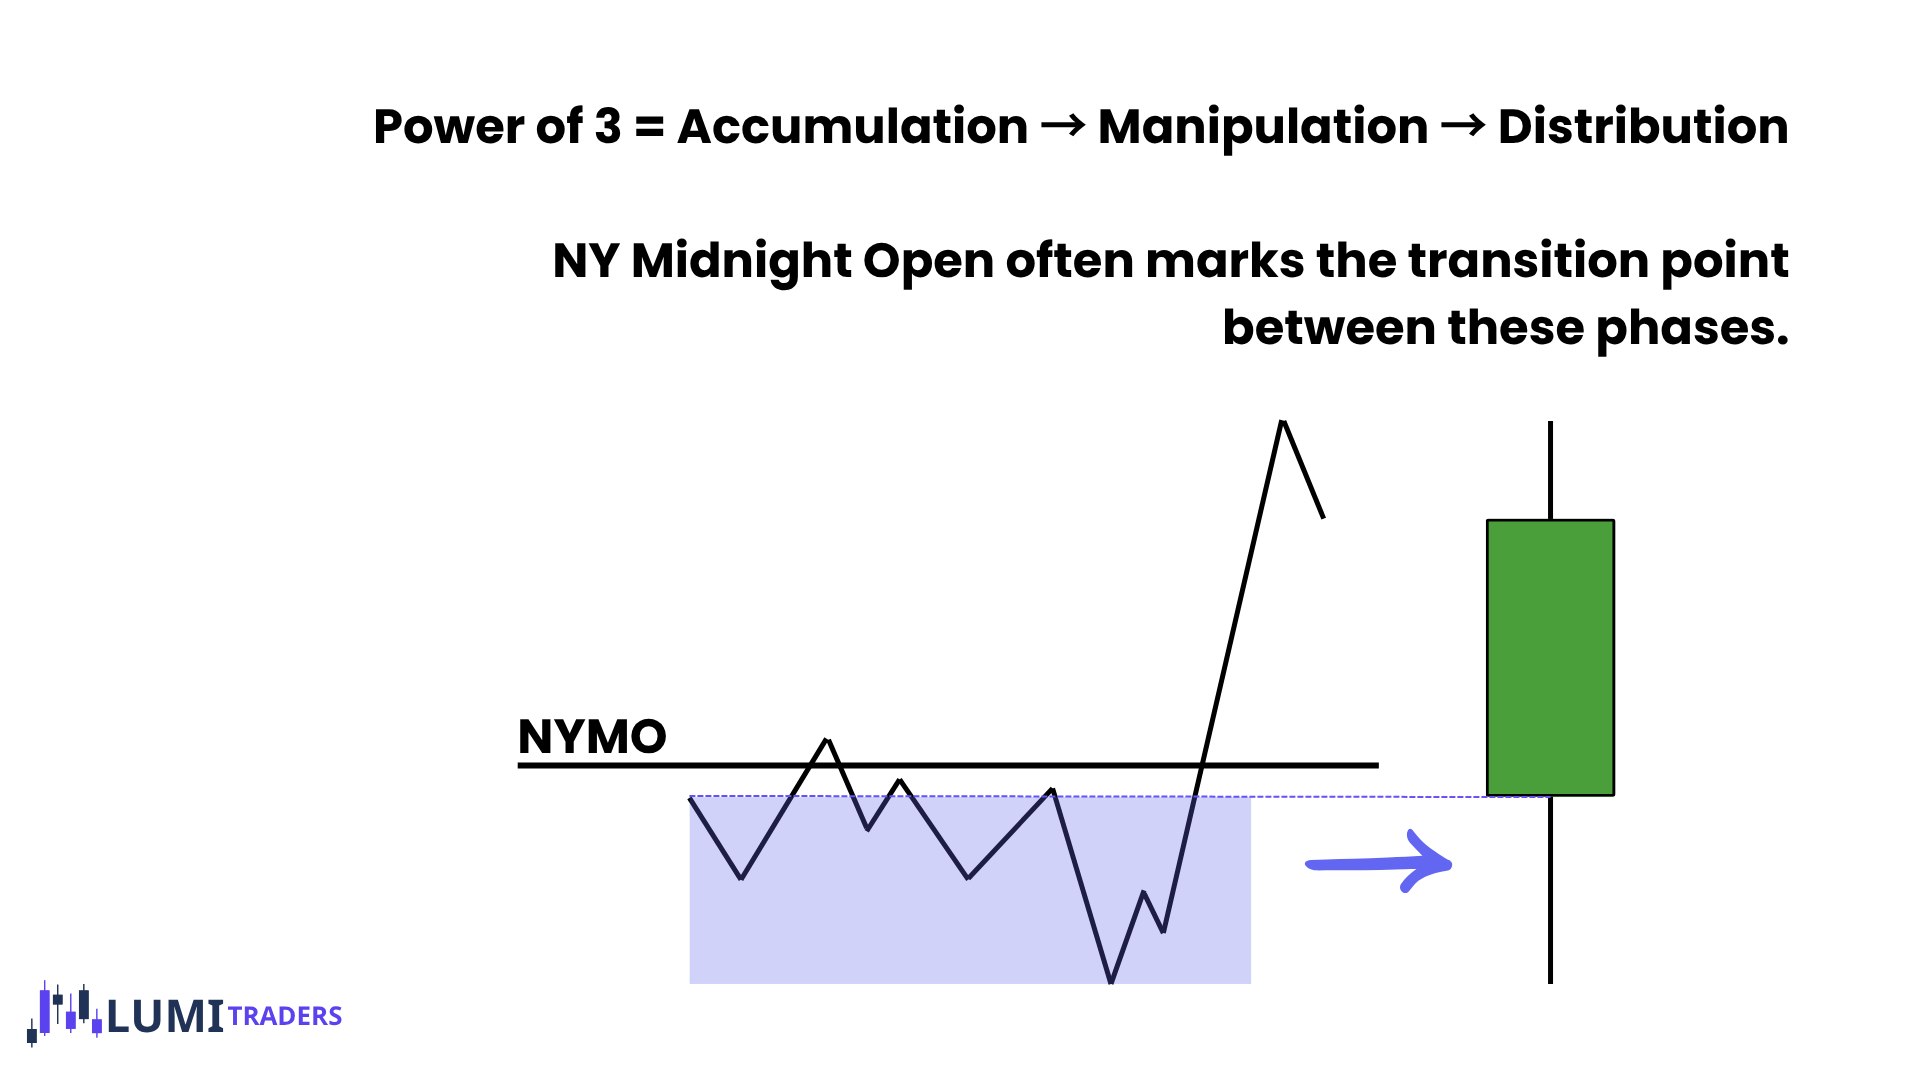
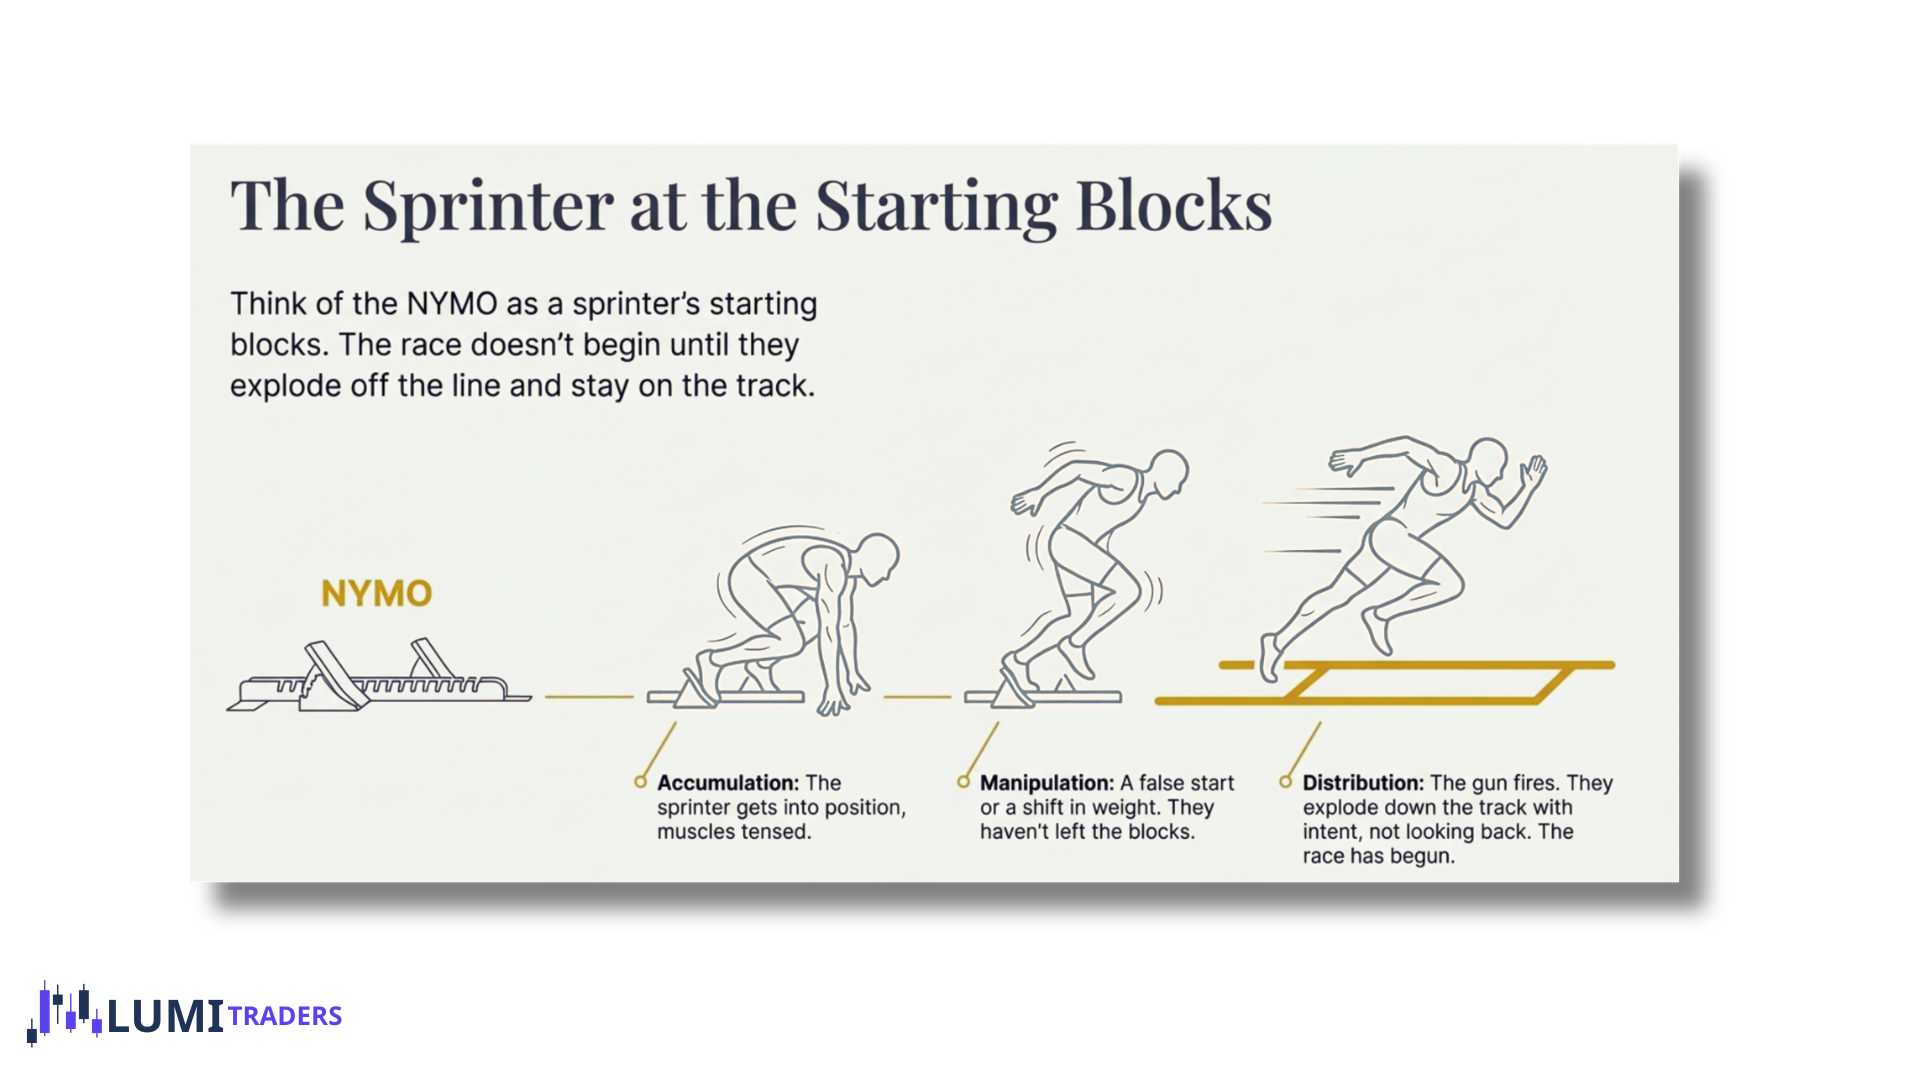
Phase 1: Accumulation (Around / Just After NYMO)
Price trades around NY Midnight Open
Range is narrow
No direction yet
This is where the dealing range is being built.
At this stage:
Being above or below NYMO means nothing
Bias is not confirmed
This is where the “buy below / sell above” logic fails most of the time.
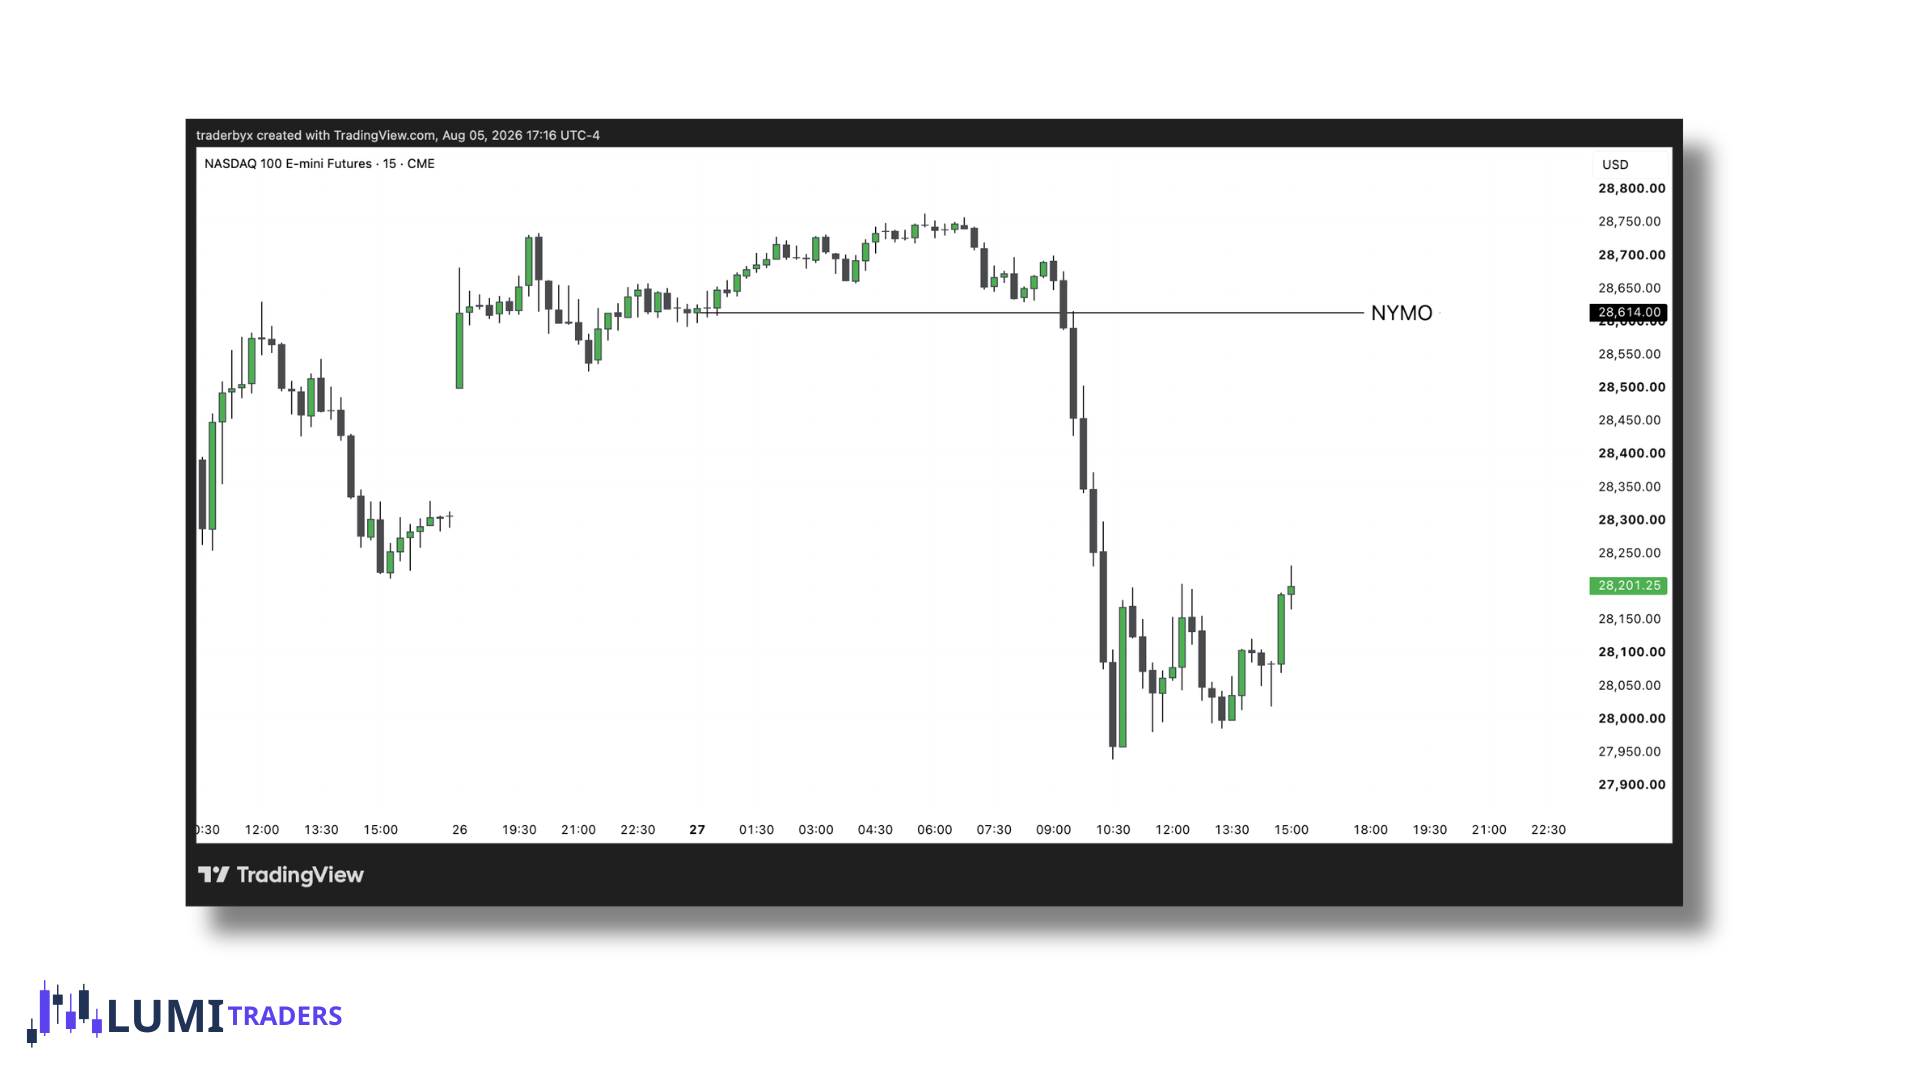
Phase 2: Manipulation (False Move Relative to NYMO)
Price will usually:
Move below NYMO or
Move above NYMO
But without follow-through. Most likely it will tap HTF level.
This is the manipulation leg of Power of 3.
Key point:
Price being below NYMO does NOT mean discount
Price being above NYMO does NOT mean premium
It only means manipulation is active.
Reversal from manipulation area must be confirmed by CISD.
Phase 3: Distribution (THIS Is Where Real Move Happens)
Distribution begins ONLY AFTER:
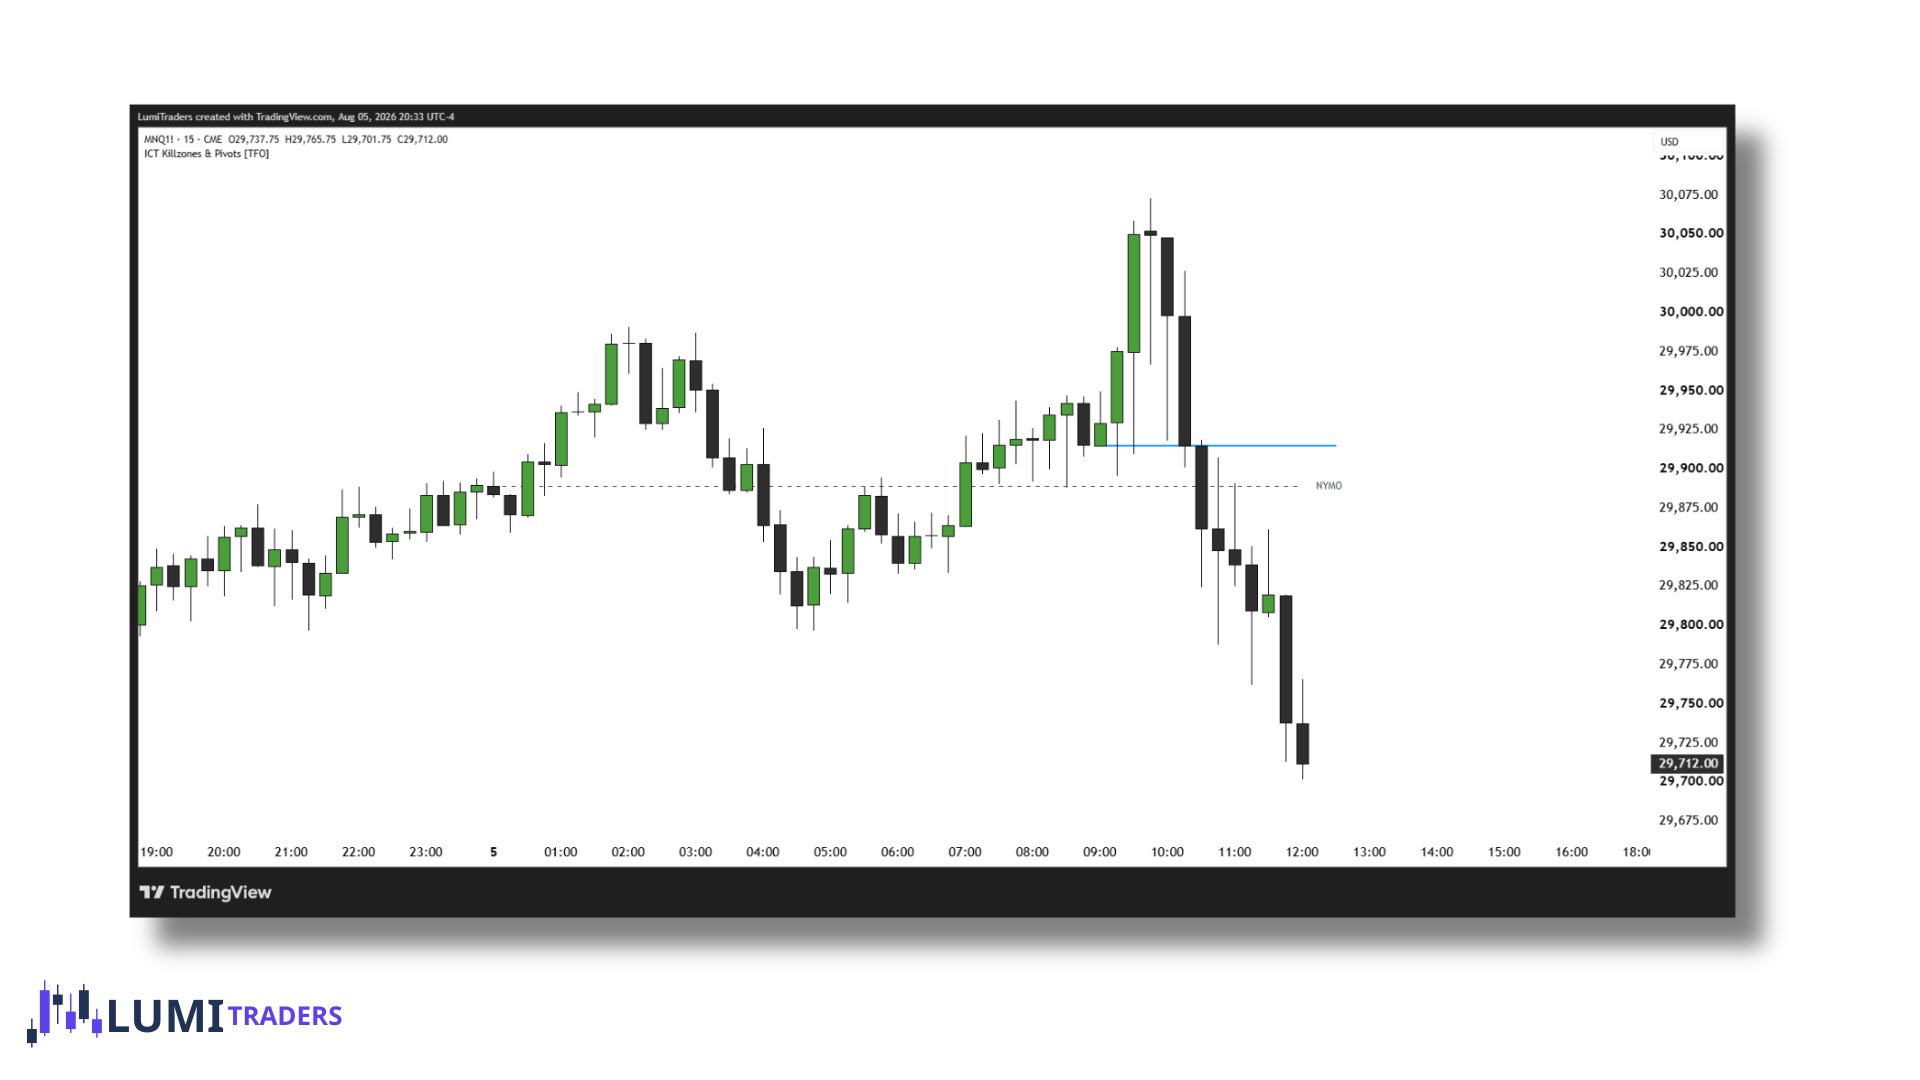
Price breaks NY Midnight Open
A candle closes beyond it
Price stays away from the origin
Why?
Because price cannot expand if it keeps returning to where it started.
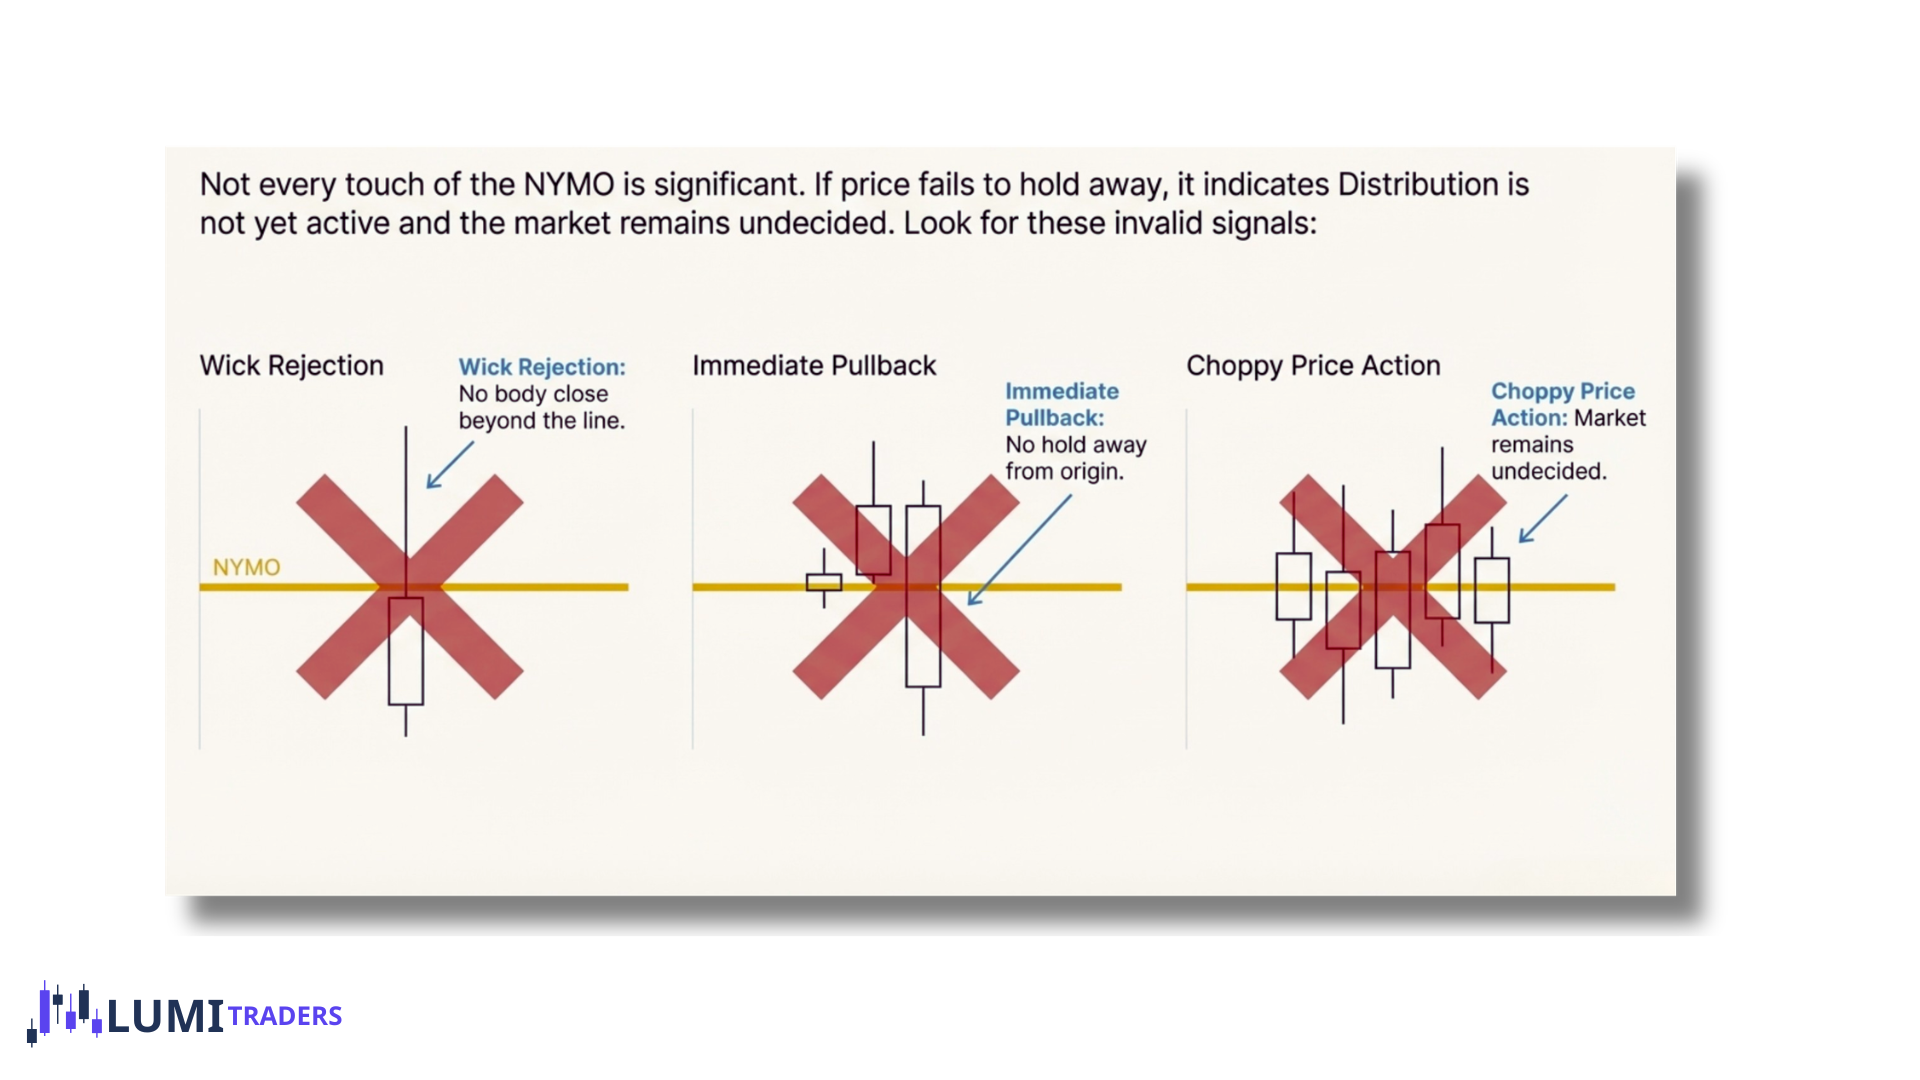
If price keeps coming back:
You are still in manipulation
The dealing range is not finalized
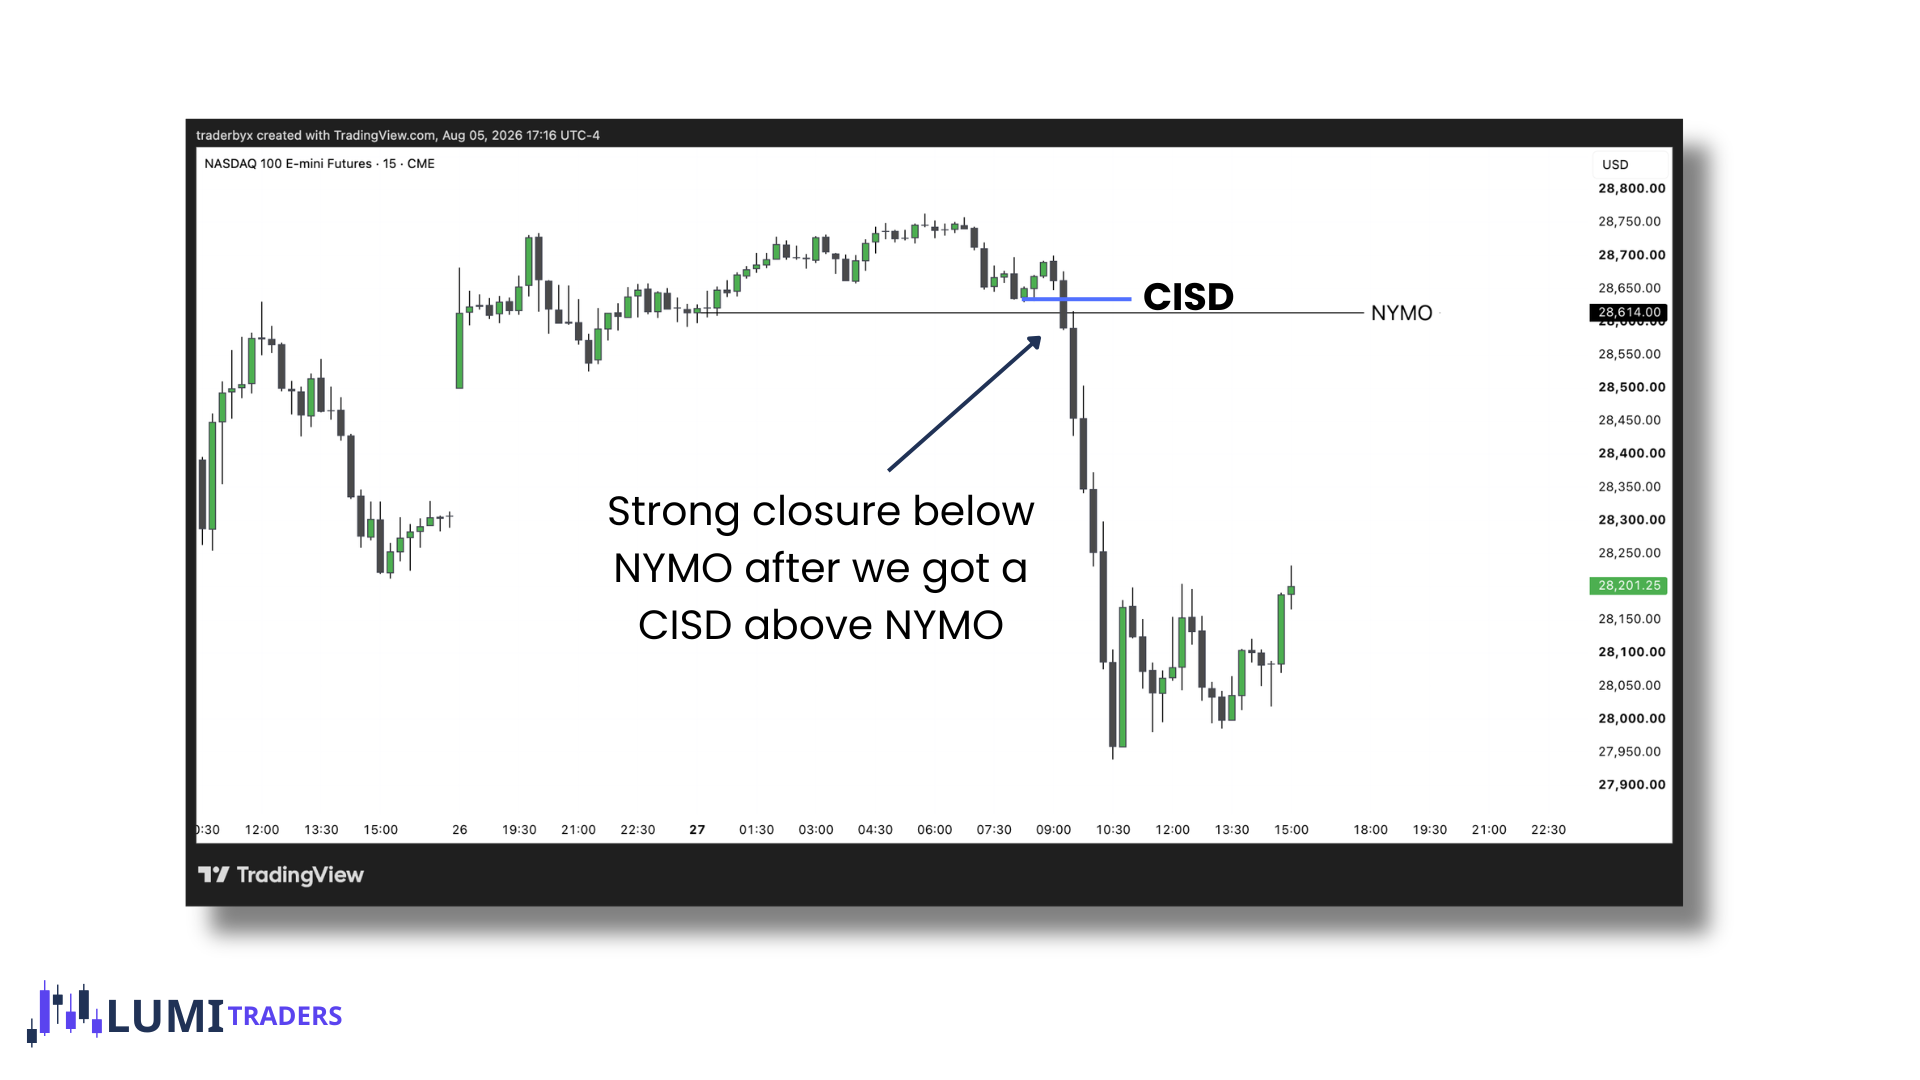
Why Break & Close Works Better
When price breaks and closes above NYMO:
Accumulation is finished
Manipulation has completed
Distribution has begun
The dealing range is expanding upward
So now:
Buying makes sense after the break up
Selling makes sense after the break down
You are trading distribution. Not guessing manipulation
Dealing Range Perspective
NY Midnight Open is the centerline of the dealing range early in the day.
Only after distribution starts we get:
True range expansion
Clear premium/discount zones
Measurable highs and lows (obvious swing points)
So logically:
You can’t trade discount until the range exists.
And the range does not exist until price holds away from NYMO.
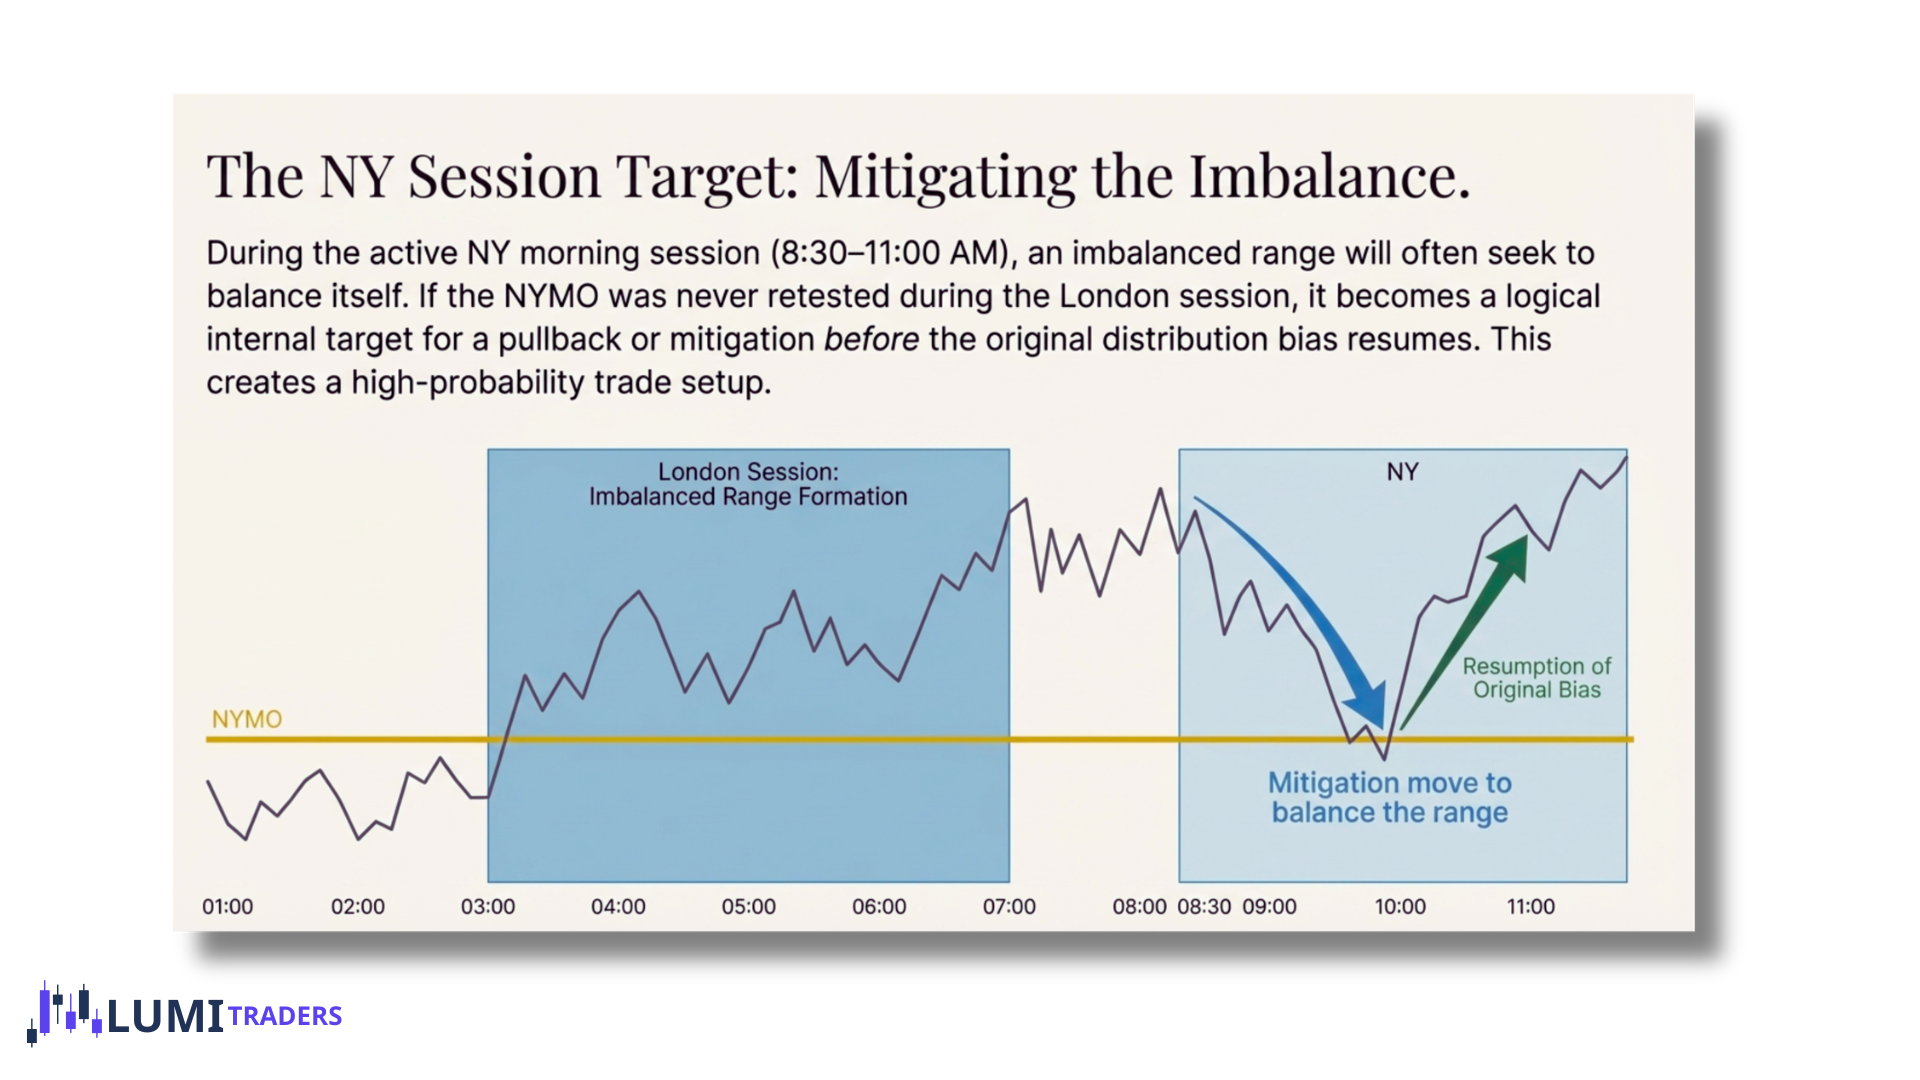
If the NY Midnight Open is not retested between 3–7 AM, the probability shifts toward a retest during 8:30–11:00 AM.
Why 3–7 AM Matters First (Range Formation Window)
The intraday dealing range is being defined
Accumulation + manipulation are active
Price often:
Tests NYMO
Or clearly rejects it
If NYMO gets retested here, then:
The range is balanced
Distribution can continue without needing to come back
Why the Retest Shifts to 8:30–11:00 AM
Between 8:30–11:00 AM:
The session enters active expansion
The range needs:
Balance
Repricing
Continuity
If NYMO is still untouched, it becomes the most logical internal target.
So price often:
Pulls back to NYMO
Mitigates it
Then continues distribution
This is range maintenance, not reversal.
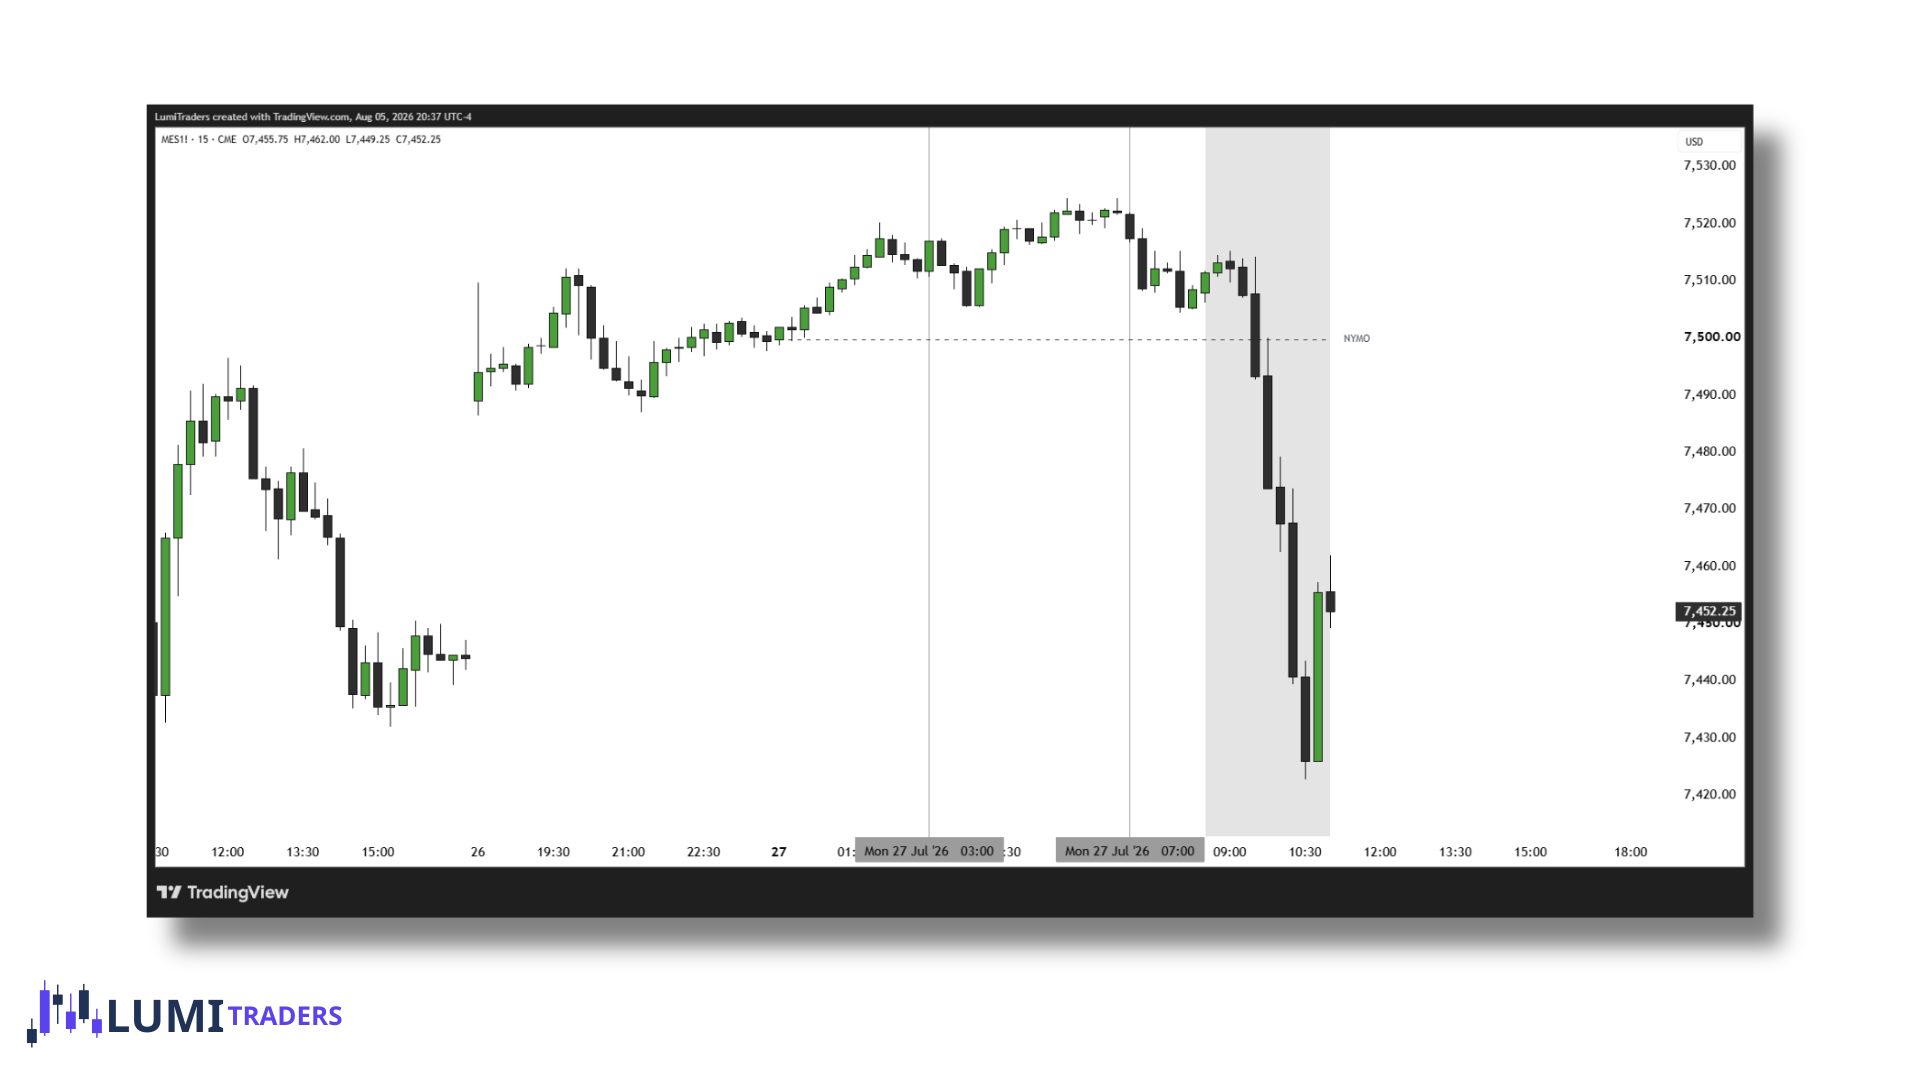
What It Means When NYMO Is Not Retested
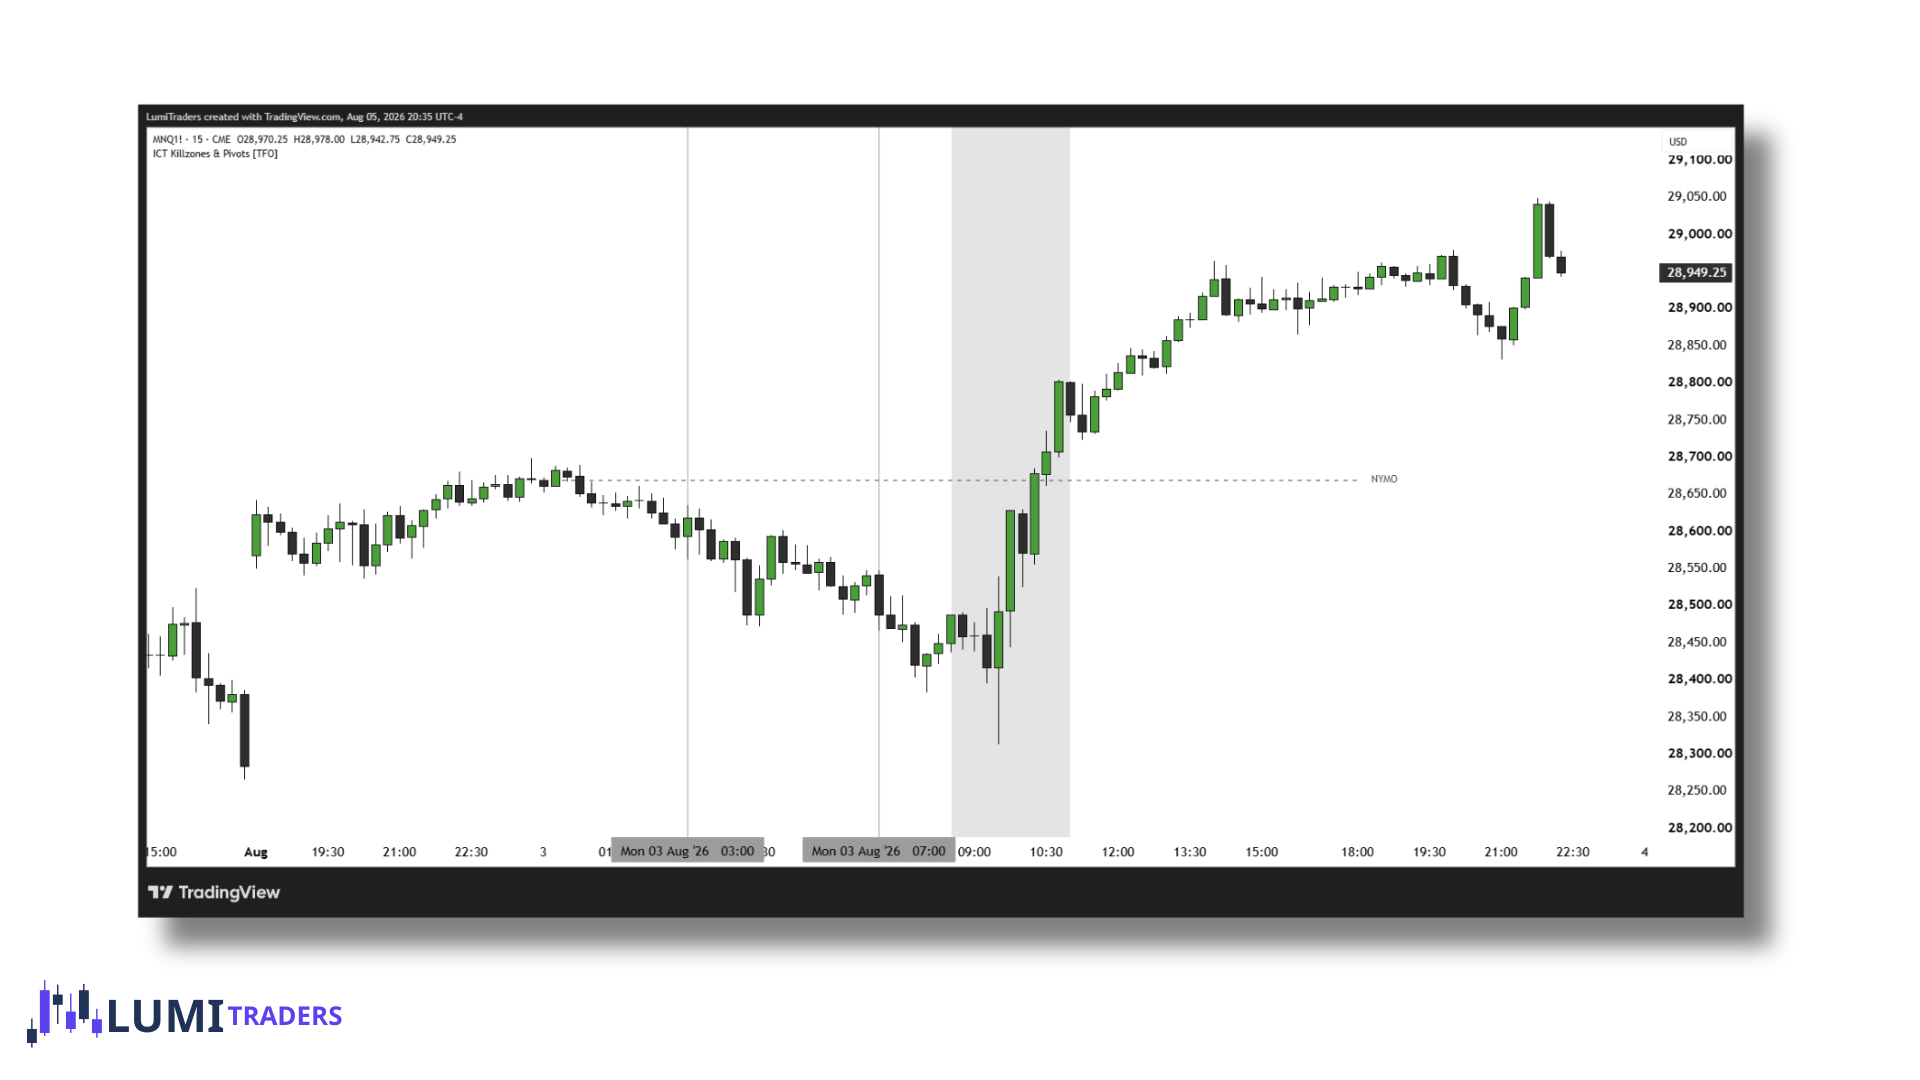
If price:
Expands away from NYMO
Does not come back to it by ~7 AM
Then mechanically:
The dealing range is imbalanced
The origin of the range is untested
Distribution is incomplete
In Power of 3 terms:
Accumulation → Manipulation happened
Distribution started without mitigation
That creates unfinished business in the range.
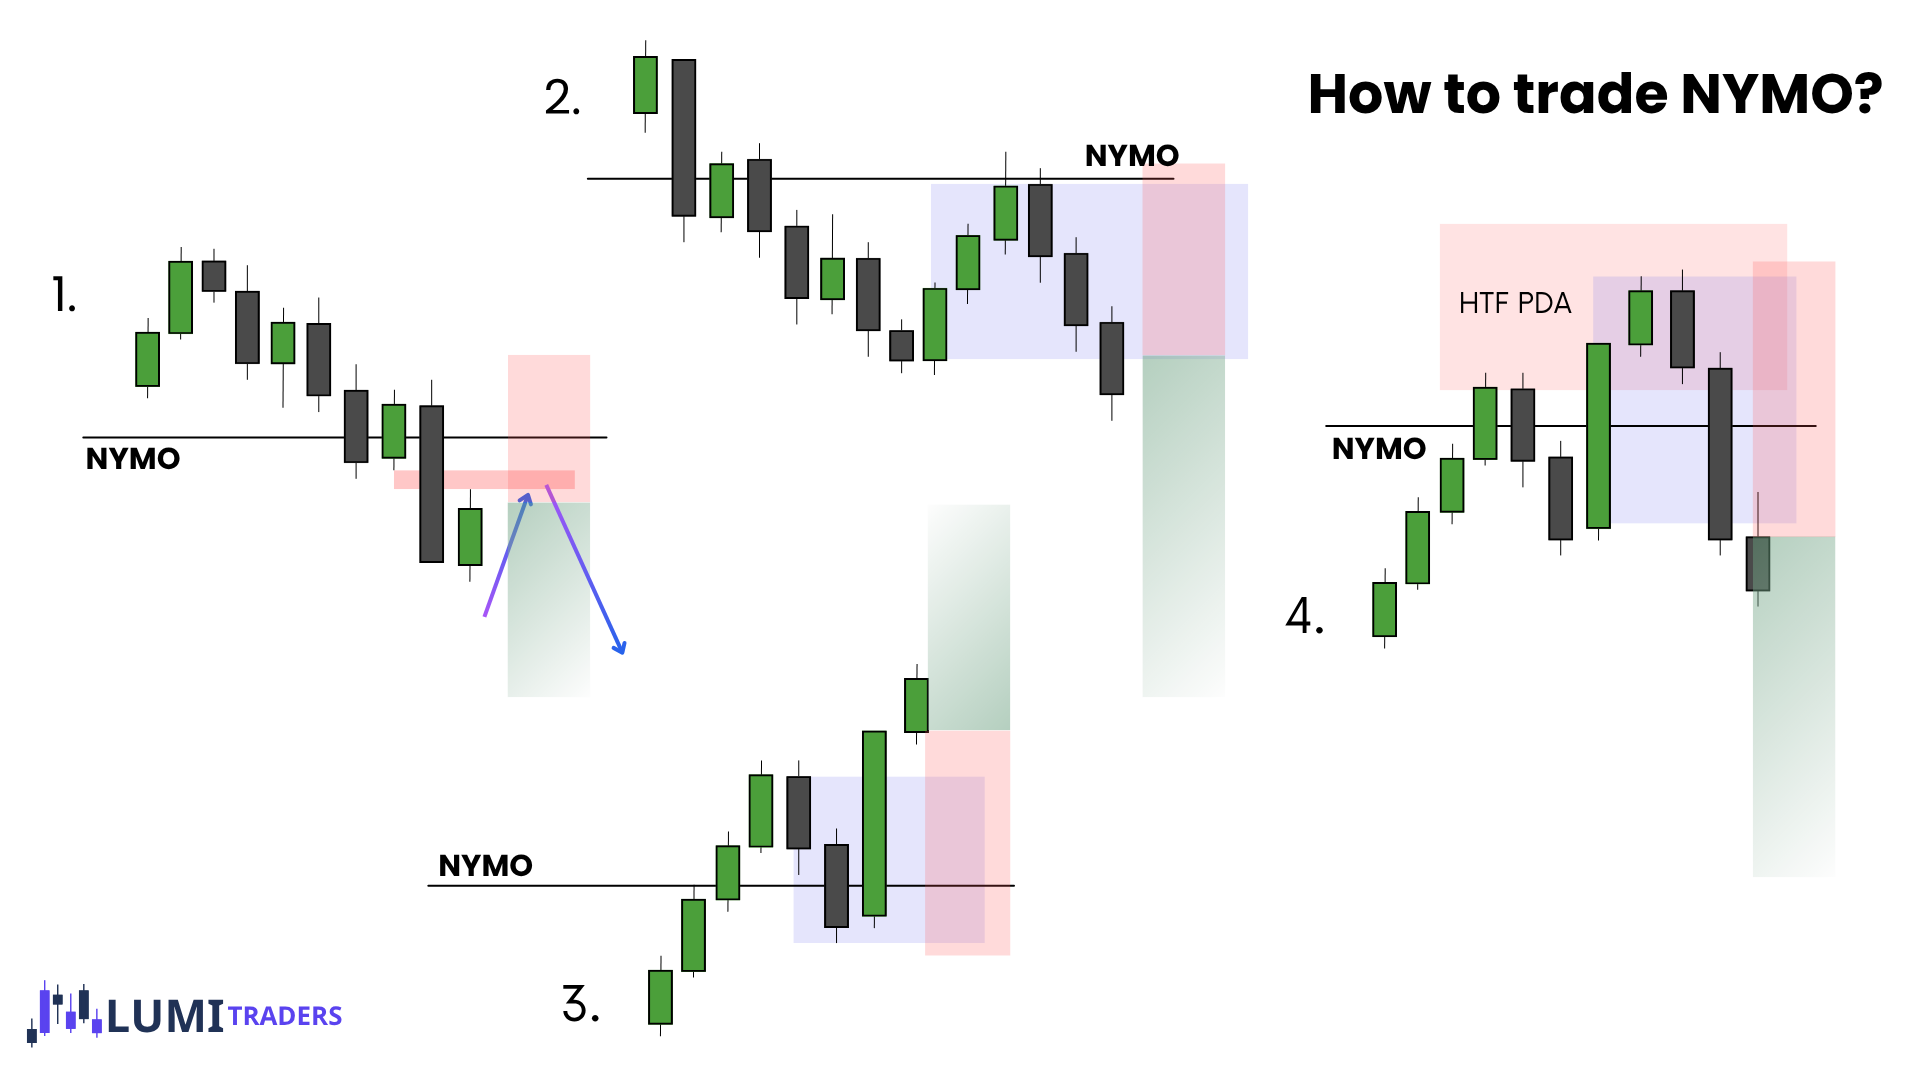
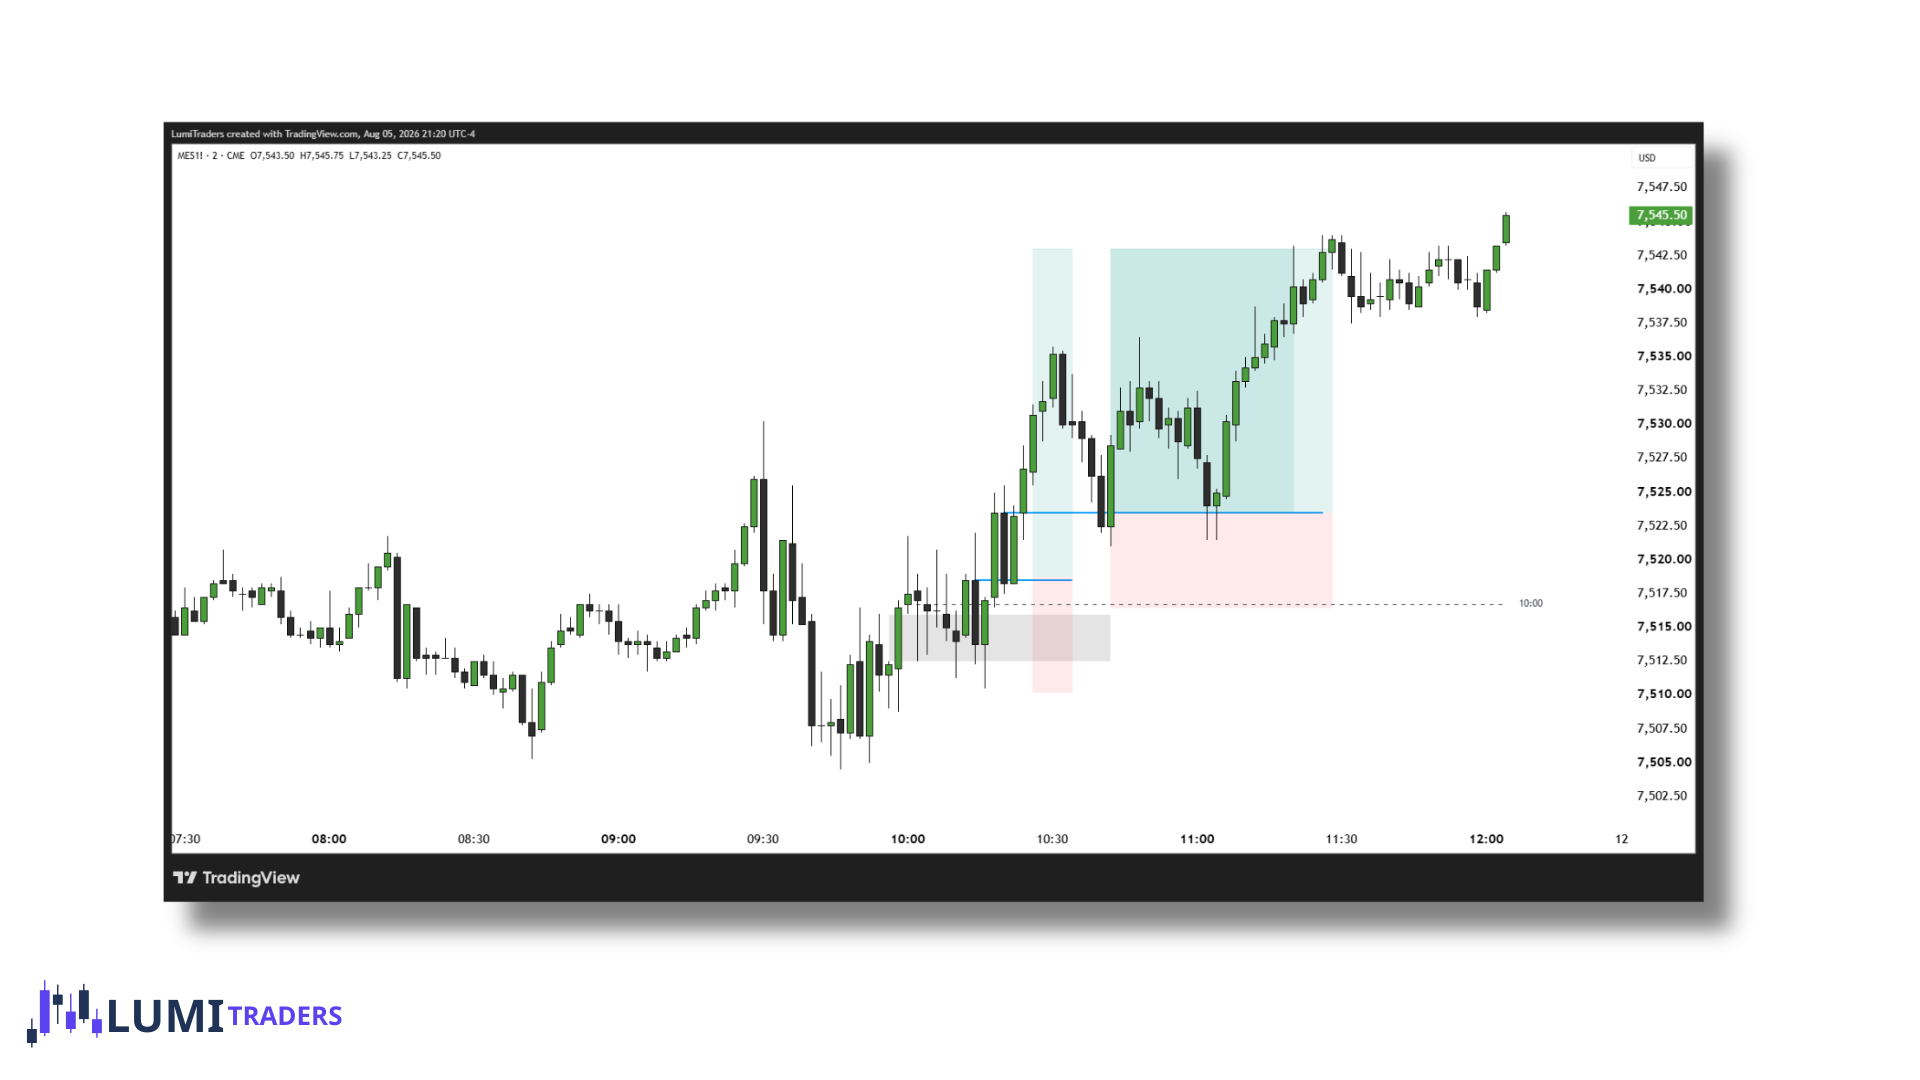
Example
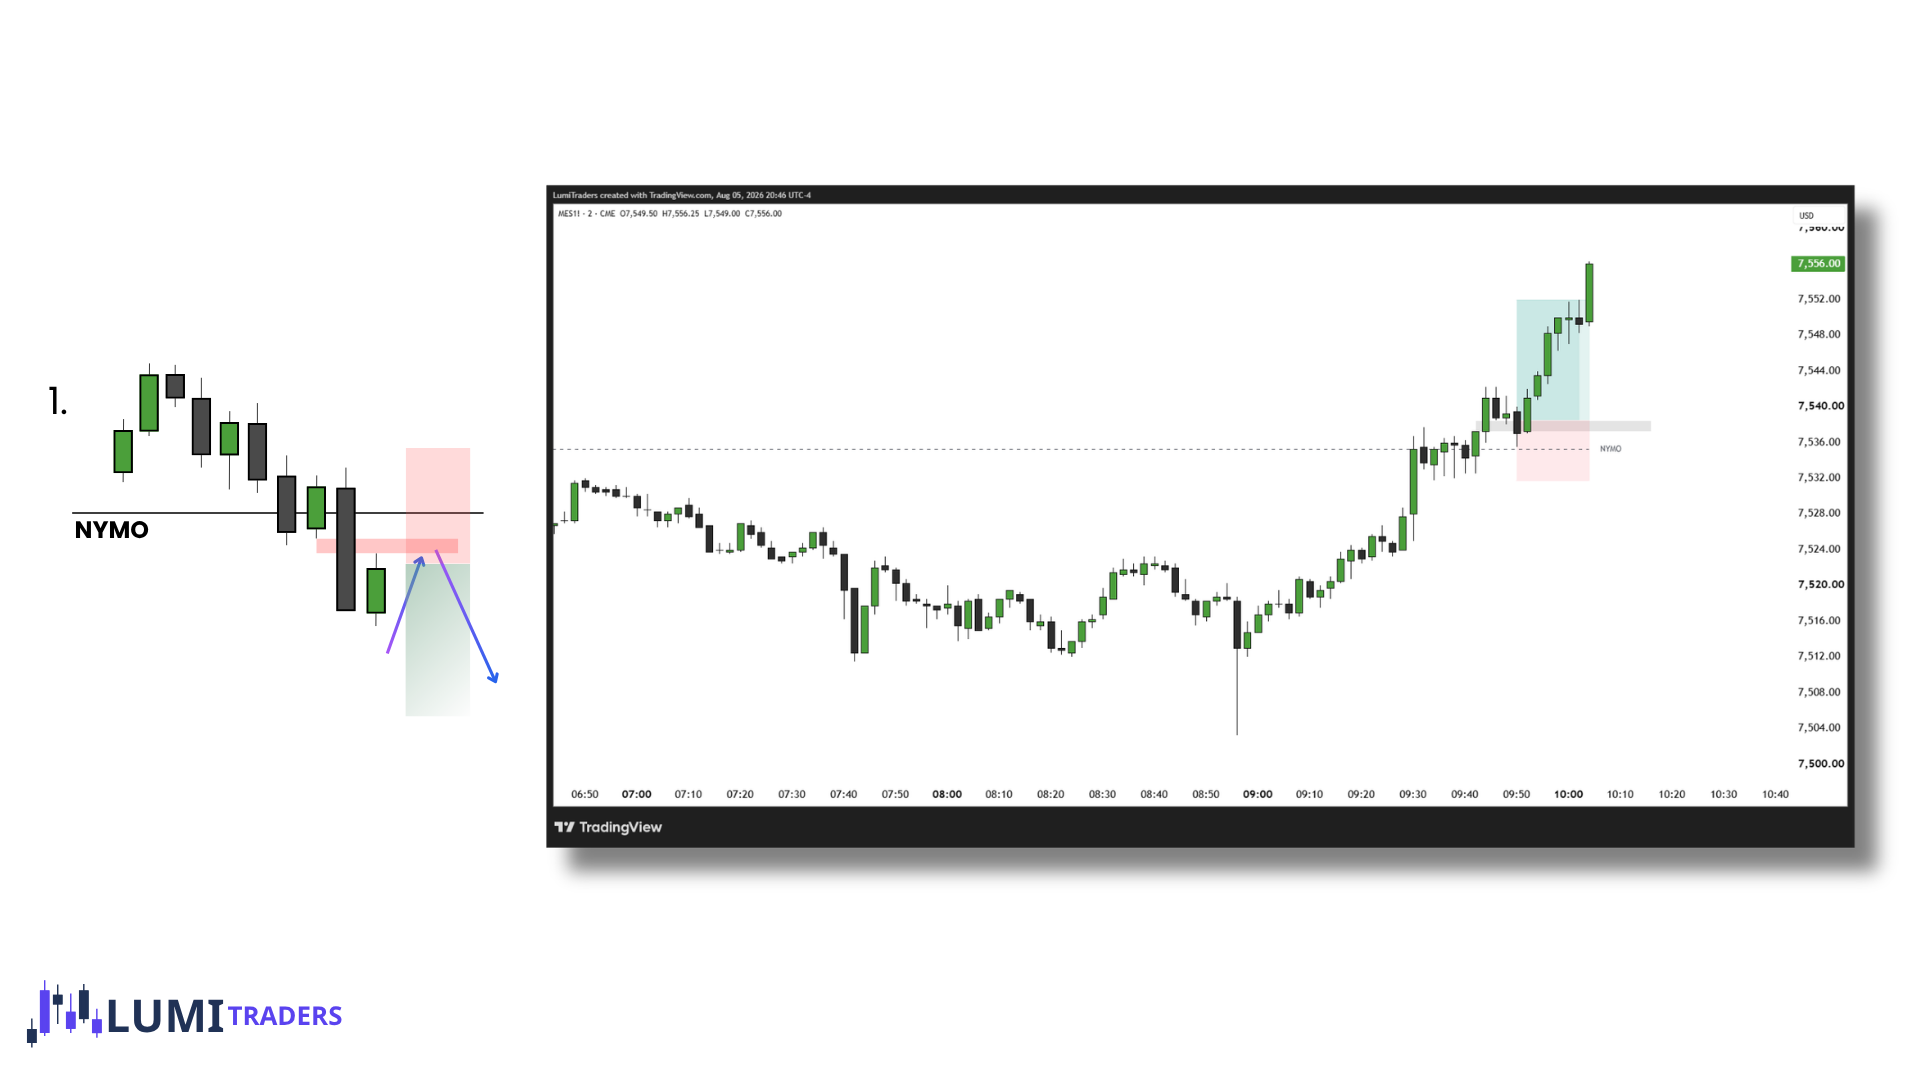
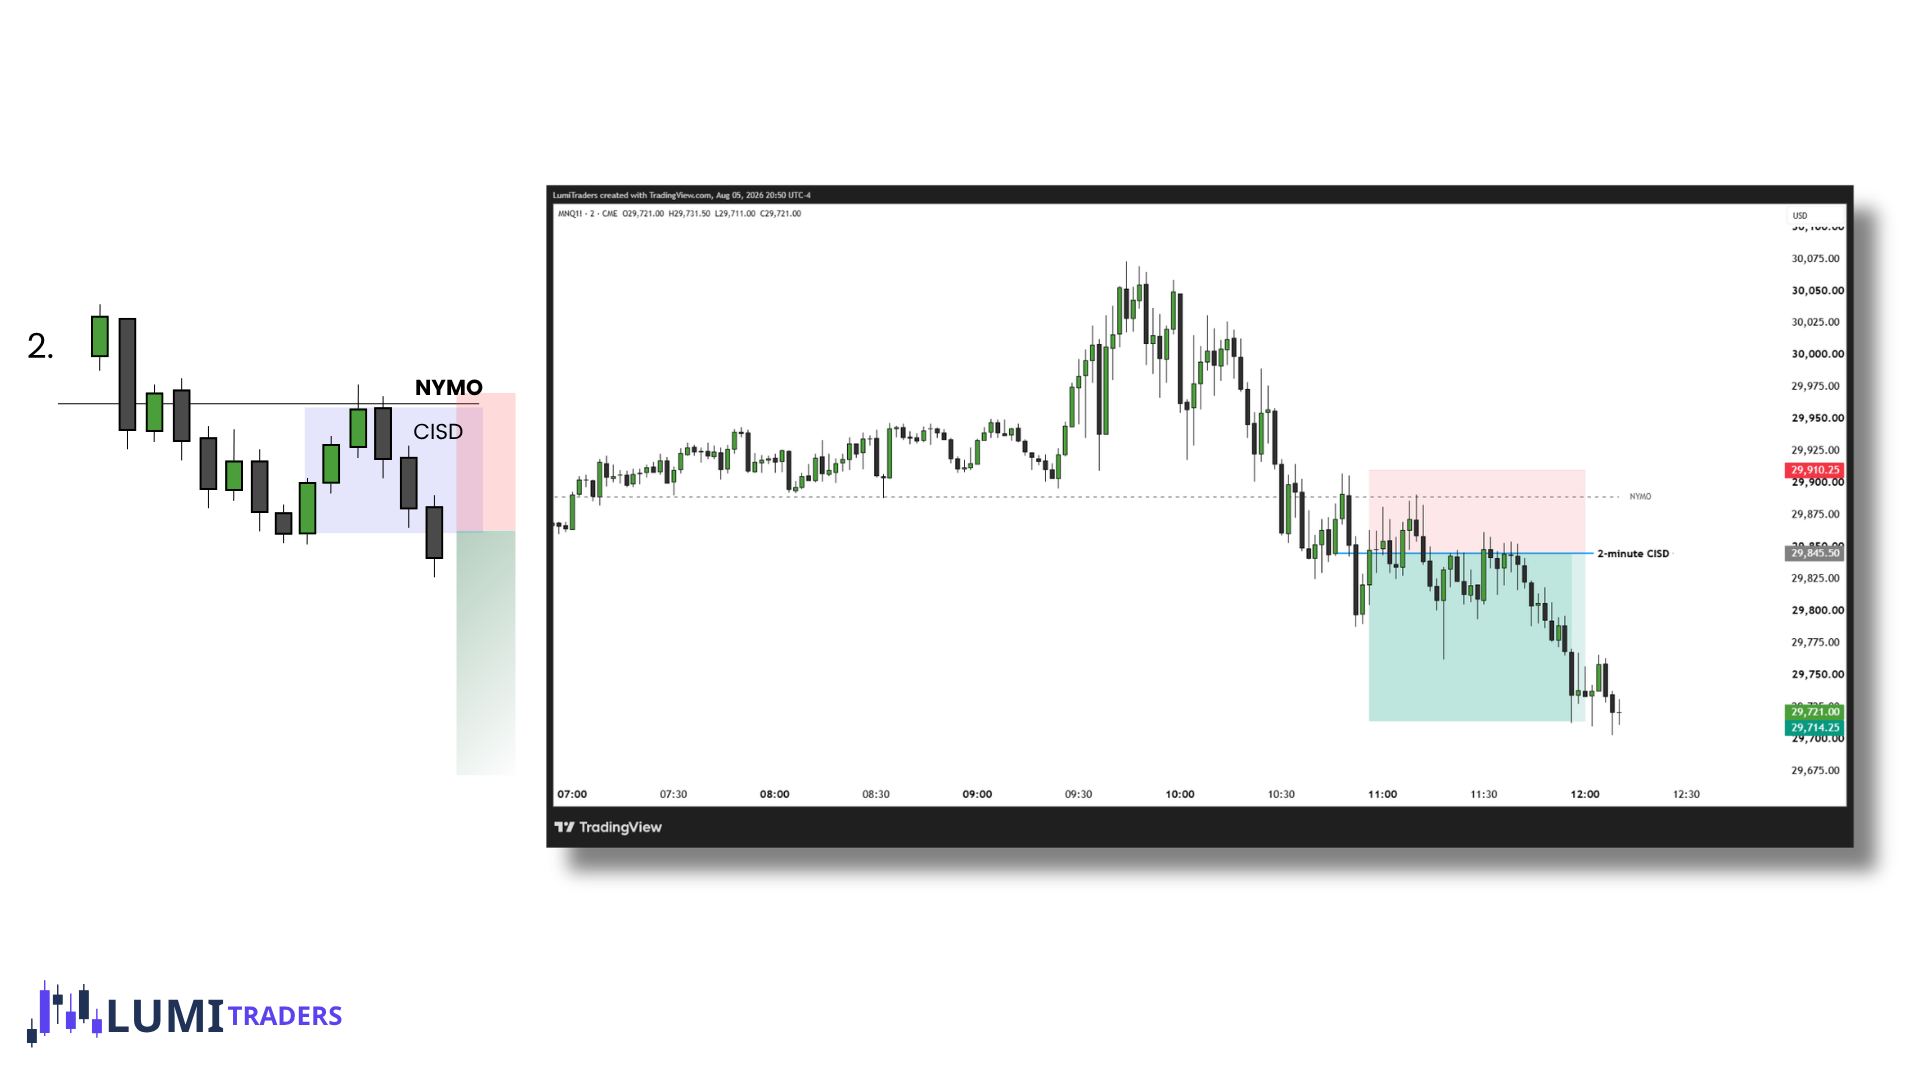
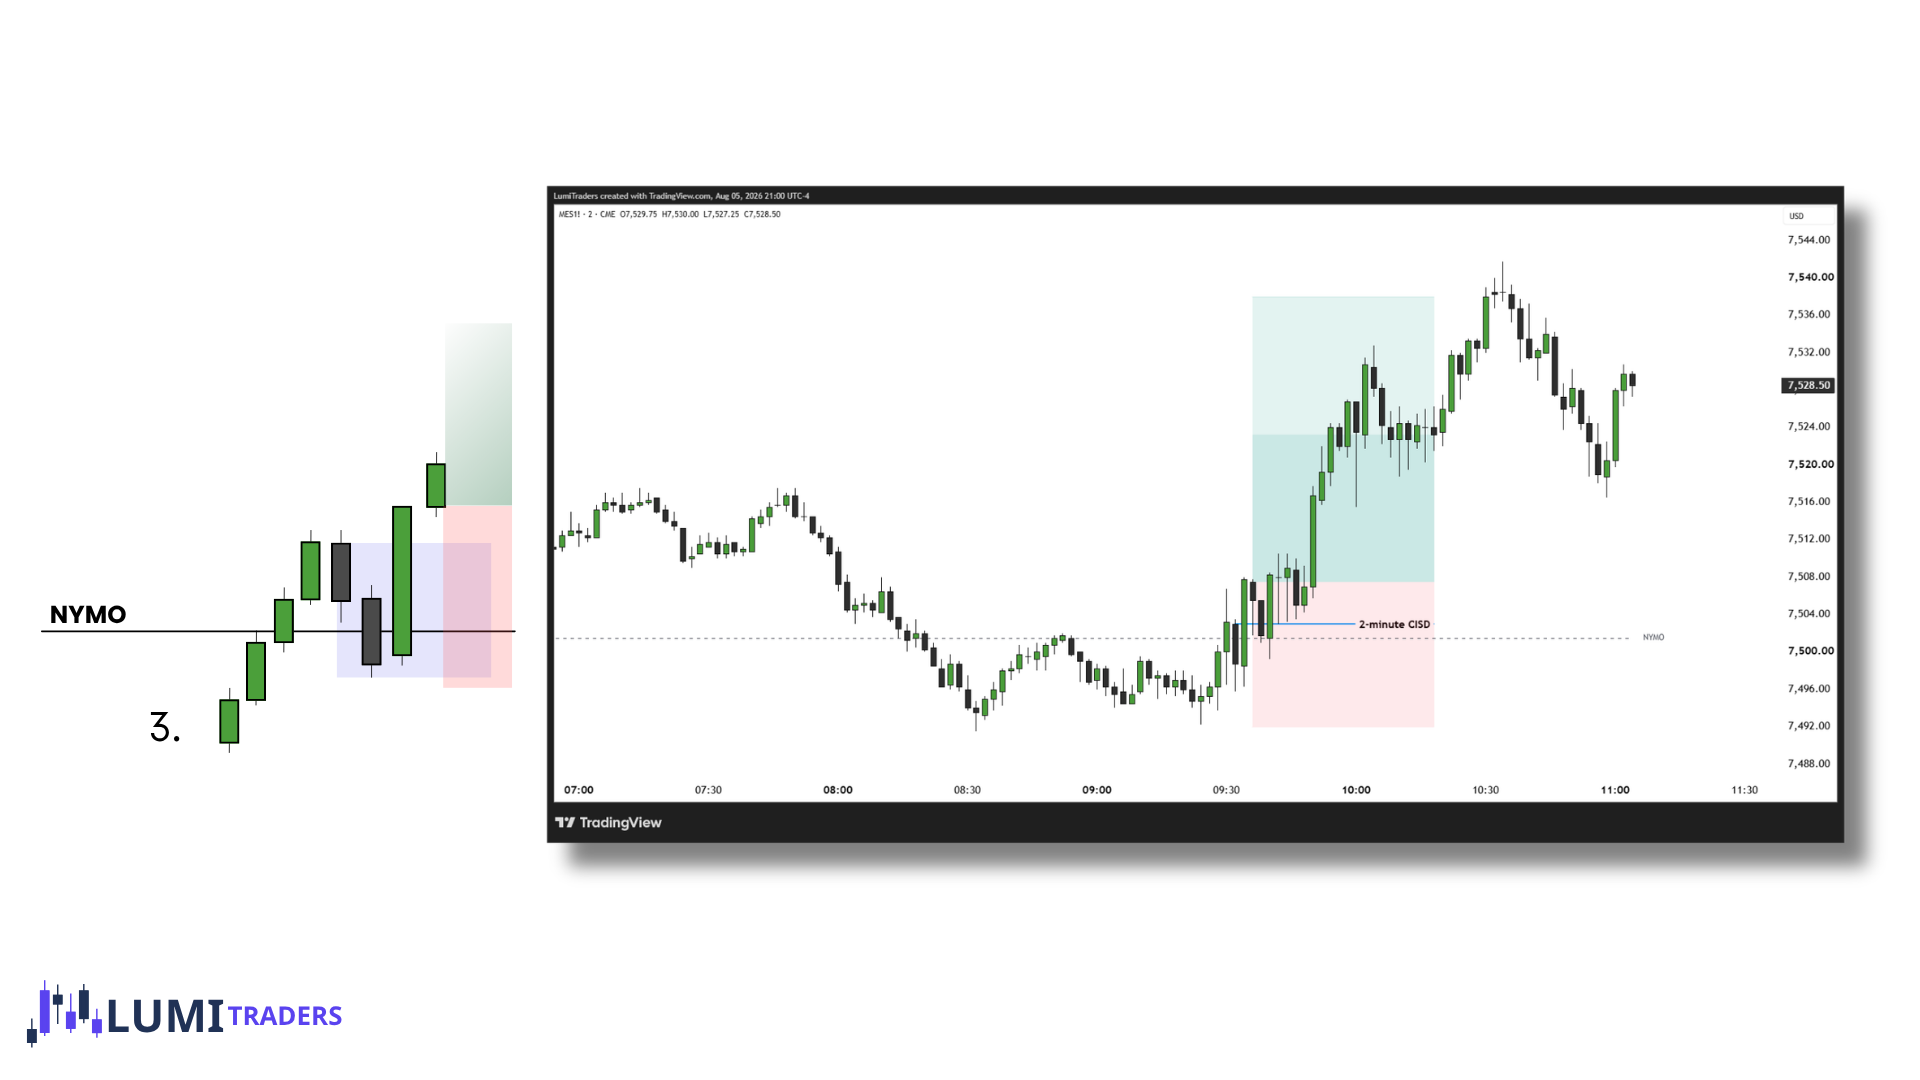
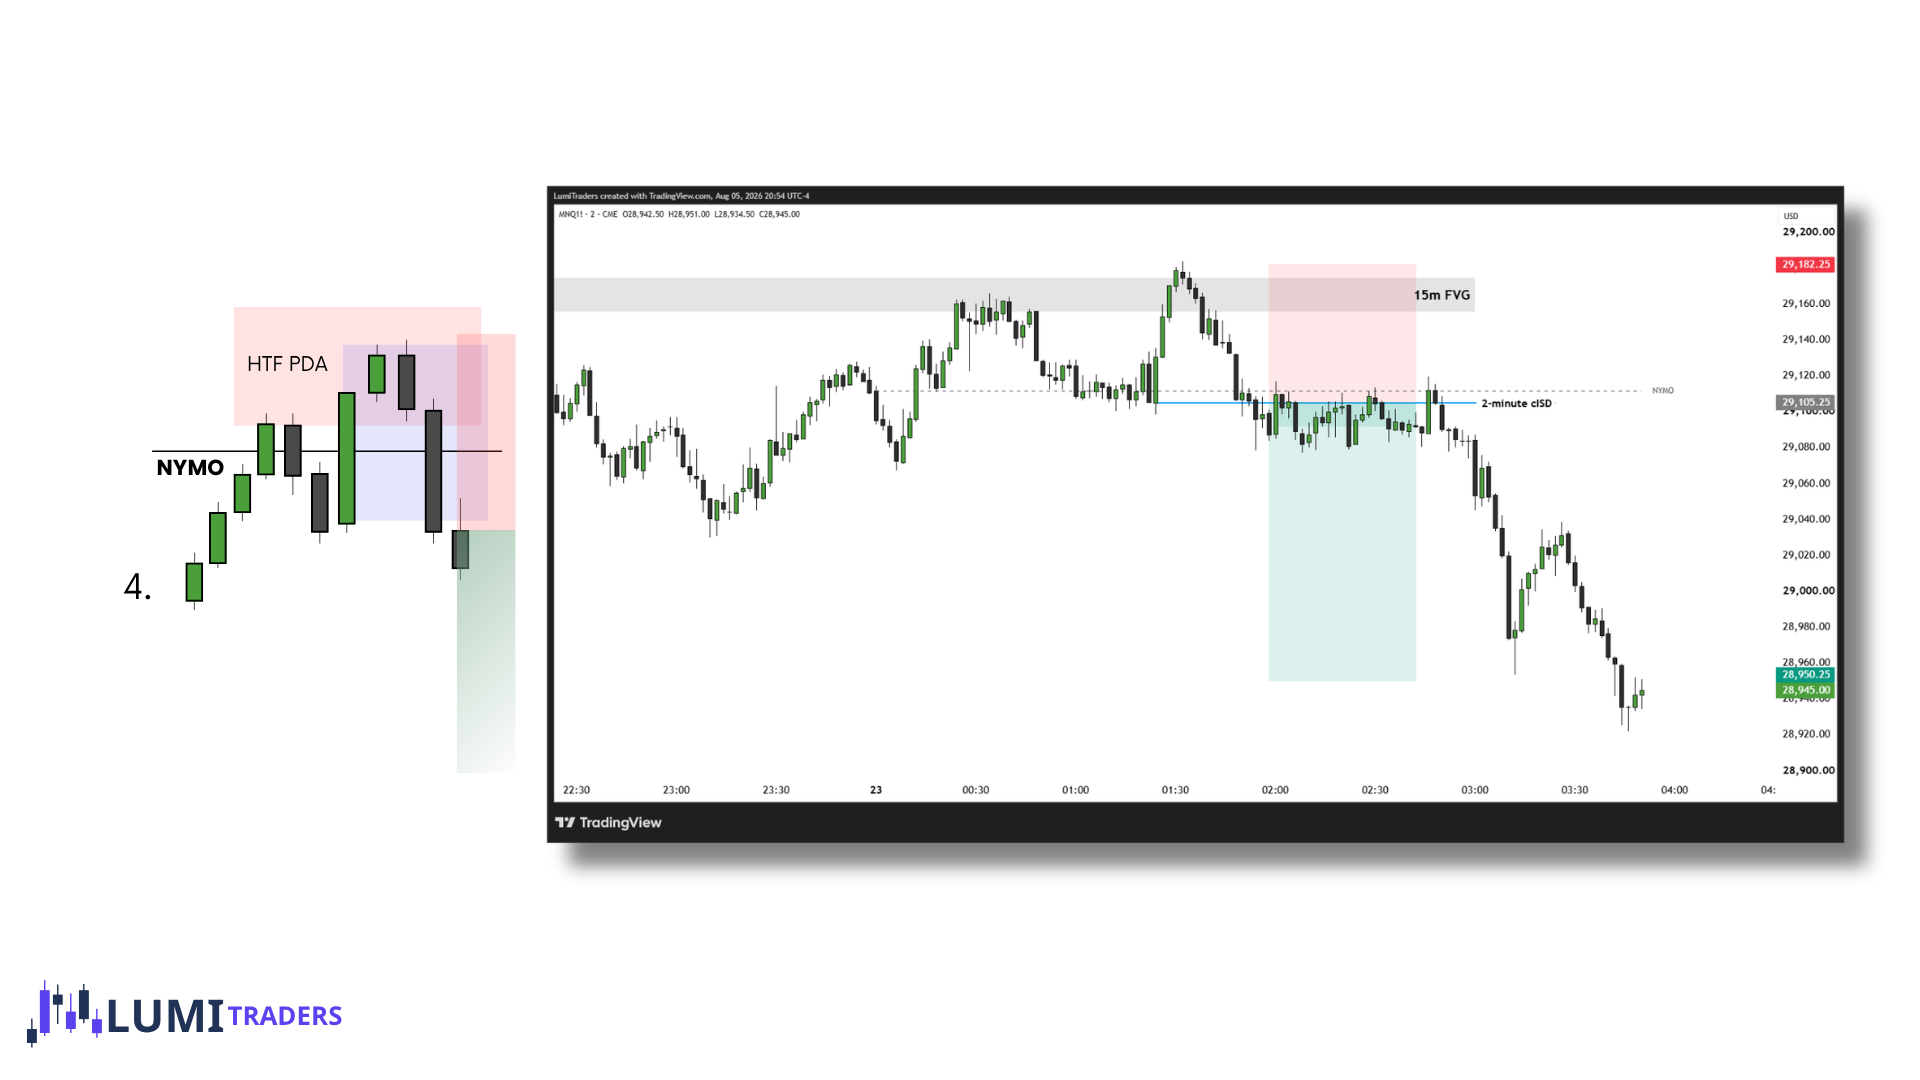
Above, I presented 4 entry models that you can use when trading from NYMO.
For all entry models, I use the 2-minute chart for execution.