RTH gaps & Fibonacci
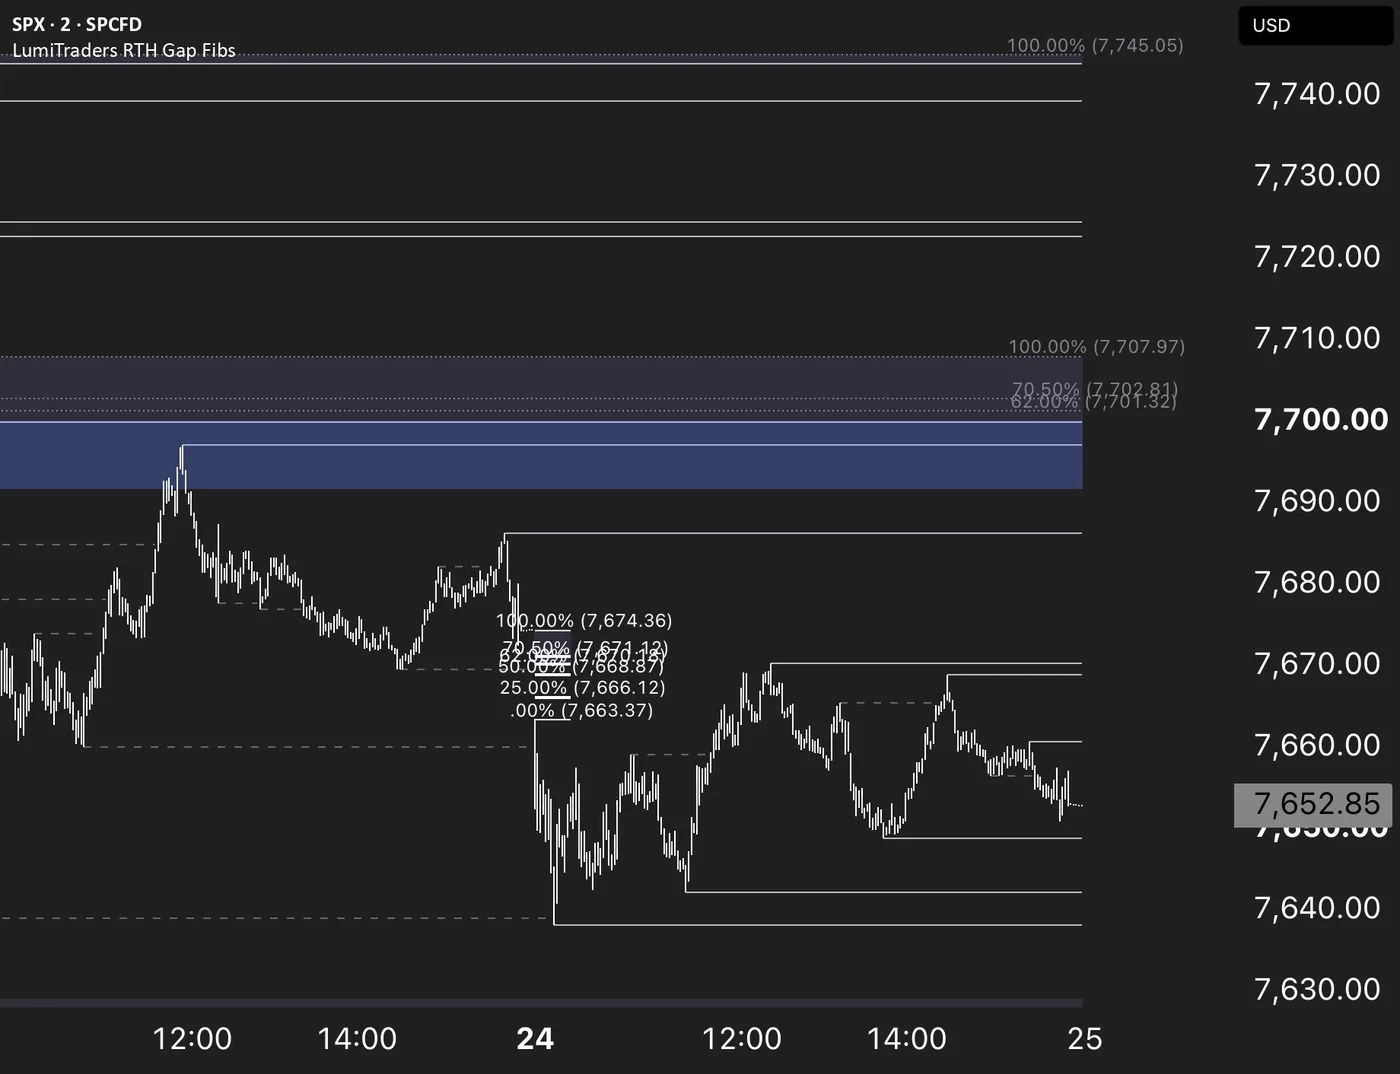
SPX RTH Gap with Fibonacci
Fibonacci levels across every RTH gap, the unfilled part of past gaps carried forward, and a box wherever an old gap overlaps today's — drawn automatically on any intraday chart.
Free TradingView indicator by LumiTraders (opens in a new tab)
- Free to use
- Protected script
- No download
Opens the official script page. A free TradingView account is required.
- Platform
- TradingView · web & mobile
- Access
- Free · protected source
- Chart compatibility
- Intraday charts; 4H or lower
- Latest script update
01 / Overview
What this indicator does
SPX Regular Trading Hours (RTH) Gap with Fibonacci is a free TradingView indicator by LumiTraders that measures the gap between the prior regular-session close and the new session open, maps up to ten customizable Fibonacci levels across it, keeps the unfilled portion of past gaps projecting across sessions and marks where old gaps overlap today's.
Use it when
You want to map the gap from the prior regular-session close to the next open, then track which Fibonacci levels remain unfilled.
- Measures the RTH gap
- At every session open the indicator anchors the previous regular-session close and the new session open, and places its levels between the two.
- Ten customizable Fibonacci levels
- Each of the ten level slots has its own enable switch, level value, color, line width and line style, and any value works — including negatives and extensions beyond 100%.
- Unfilled-gap projection
- Every level of a past gap is tracked individually: a level price trades through stops at the bar where it was tagged, while untouched levels keep projecting forward across sessions.
- Overlap zones
- Where a past gap's unfilled remainder intersects today's gap range, a separate box marks the shared area and shrinks as the old gap fills, disappearing once the ranges no longer touch.
- Confirmed-break recolor
- A level changes color only when a candle closes through it on the confirmation timeframe you choose; a wick that fails to close beyond the level leaves it untouched, and neither path repaints.
- Automatic cleanup
- Fully balanced gaps can be removed automatically — levels, labels, shading and overlap boxes — leaving only gaps with unfilled area, which also frees drawing slots for a longer history.
The gap is measured from the regular-session close to the next session open. Session times and the timezone are editable; daily and higher charts do not draw the levels.
02 / Get started
Add it to your TradingView chart
Save it once. Find it in your favorites on desktop and mobile.
Save the script
Open the script page on TradingView and select Add to favorites. Sign in to your TradingView account first; a free account is enough.
Open a compatible chart
Intraday charts; 4H or lower. Choose the instrument and timeframe you want to study.
Add it from your favorites
Select Indicators → Favorites → LumiTraders RTH Gap Fibs. The indicator draws directly on your chart. Open its settings to adjust the display.
Intraday only — nothing draws on daily or higher charts. If the chart looks empty, switch to 4H or lower.
03 / Configuration
Settings, explained
Start with the session or timeframe, then choose which drawings you want to keep on the chart.
Setting names are paraphrased from the published description. Open the script settings on TradingView for the exact labels.
| Setting | What it changes |
|---|---|
| Session | |
| Session times, timezone, trading days | Define the session window the gap is measured from. Defaults to US equities regular hours, but any session works. Detection handles both extended-hours and regular-hours-only charts. |
| Levels | |
| Invert anchors | By default 0% is the prior close and 100% the session open; the invert switch flips the two. |
| Level slots 1–10 | Per slot: enable, level value, color, line width, line style. Each level prints its percentage and price on the chart. |
| Gap tracking | |
| Count extended-hours trade as a fill | Whether overnight and premarket trade tags a level, or only regular-hours trade does. |
| Tagged levels: freeze or delete | What happens to a level once price trades through it — it stops at that bar, or it is removed. |
| Past-session styling | Give past-session projections their own color, width, style and label behavior so they read differently from today's gap. |
| Extension | |
| Today's gap extension mode | Follow the current bar, freeze at the session close, run a fixed number of bars, or extend to the right edge. Lines, labels and shading follow the chosen mode. |
| Past gaps extension mode | Same four modes, set independently — or mirror today's setting to keep them linked. |
| Unbalanced zone | |
| Zone scope and fill | Shade the unfilled remainder of all sessions, past sessions only, or today only; optionally shade the whole gap instead of just the unfilled slice. |
| Overlap zones | |
| Minimum overlap size (ticks) | Filters marginal intersections between an old gap's remainder and today's gap so they are not drawn. |
| Confirmed break | |
| Confirmation timeframe | The timeframe whose candle close decides a break. Matching the chart uses the bar's final close; a higher timeframe uses its most recently completed candle. |
| Mode and tick threshold | Automatic in both directions by default (each level remembers which side price started on); fixed one-direction modes are available. The threshold requires the close to clear the level by a set distance. |
| Debug plot | Draws the exact close being compared, so the recolor logic is verifiable on the chart. |
| Housekeeping | |
| Auto-remove balanced gaps | Clears a gap's levels, labels, shading and overlap boxes once it is fully filled, with an override that keeps today's gap on screen regardless. |
| Labels | |
| Label content and placement | Percentage and price toggled independently; four positions (left/right, plain or boxed); five text sizes; bar offset; line-matched or manual color; auto or fixed decimals; optional thousands separator. |
| Filters | |
| Minimum gap size and direction | Ignore gaps smaller than a set number of ticks; optionally draw gap-up-only or gap-down-only. |
| Extras | |
| Level shading, gap readout, status label | Optional shading between adjacent levels, a gap-size readout in points, ticks or percent, and a diagnostic label reporting what the script sees when nothing draws. |
04 / Reference
Alerts and limitations
Know what triggers an alert and which chart conditions affect the drawings.
Available alerts
- Level tagged
- Price trades through a level, with an option to restrict this to past-session levels only.
- Gap fully filled
- Today's gap has been completely balanced.
- Overlap entry
- Price enters an overlap zone between an old gap and today's.
- Confirmed break
- A candle closes through a watched level on the confirmation timeframe.
Before you use it
- Intraday timeframes only — above intraday there is no session boundary to measure from, so nothing draws on daily or higher charts.
- Sessions kept on the chart are capped by TradingView's drawing limits; long histories with many levels enabled drop the oldest sessions first.
- Shading between adjacent levels assumes the levels are entered in order and is not split when an individual level freezes — best left off with past-gap projections.
- The confirmation timeframe must match or exceed the chart timeframe.
A few useful answers
Frequently asked questions
Is the SPX RTH Gap with Fibonacci indicator free?
Yes. It is a free, protected-source script on TradingView. Sign in to a TradingView account to add it to your chart. TradingView's plan limits, market-data access and drawing limits still apply.
How do I add it to my TradingView chart?
Open the script page on TradingView and click Add to favorites (you need to be signed in). Then open any intraday chart and choose Indicators › Favorites › LumiTraders RTH Gap Fibs — that is the script's listing name. There is no download; the indicator runs inside TradingView, including the mobile app.
Why don't I see any levels on the daily chart?
The indicator needs an intraday timeframe. It measures the gap between one regular session's close and the next session's open, and on daily or higher charts there is no session boundary inside a bar to measure from. Switch to 4H or lower.
Which markets and timeframes does it work on?
Any instrument with a defined regular session on any intraday timeframe. It is built around the US index RTH session (SPX, ES, NQ) but session times, timezone and trading days are all inputs, and it handles both extended-hours and regular-hours-only charts.
Is the source code open?
No. The script is published as protected source: the Pine code is hidden, but access to the indicator is free. TradingView's chart, indicator and drawing limits still apply.
Can Funded.Now show the indicator live on this page?
No. Community Pine scripts only run inside TradingView — they cannot be loaded into an embedded chart widget, and the script page itself cannot be framed. This page documents the indicator; TradingView is where it draws.
How is it different from a generic gap-fill indicator?
Most gap indicators draw one box and mark it filled or not. This one maps up to ten Fibonacci levels across the gap, tracks each level of a past gap individually so only the unfilled portion keeps projecting, marks where old gaps overlap today's, and recolors a level only on a confirmed close through it.
Can I use it while trading a prop-firm account?
TradingView is a charting tool, so the indicator has no effect on any firm's rules. Execution platforms, permitted data feeds and drawdown rules are set by each firm — compare them on the prop firm pages before relying on any chart setup.
Release notes
Version history
Script updates published on TradingView, newest first.
Added liquidity levels.
Overlap zones now display the size of each overlap area.
Confirmed-break recolor: levels change color once a candle closes through them, on a timeframe chosen independently of the chart. Close-based, never wick-based, with an optional tick threshold.
Published on TradingView.
Source and authorship
This guide documents LumiTraders RTH Gap Fibs by LumiTraders, published on TradingView on . The script page is the source for the features, settings and release notes above.
Read the official TradingView description (opens in a new tab)Educational tool, not financial advice. LumiTraders is the education brand of the Funded.Now team. TradingView is a trademark of TradingView, Inc.
Build your chart
Explore the other indicators
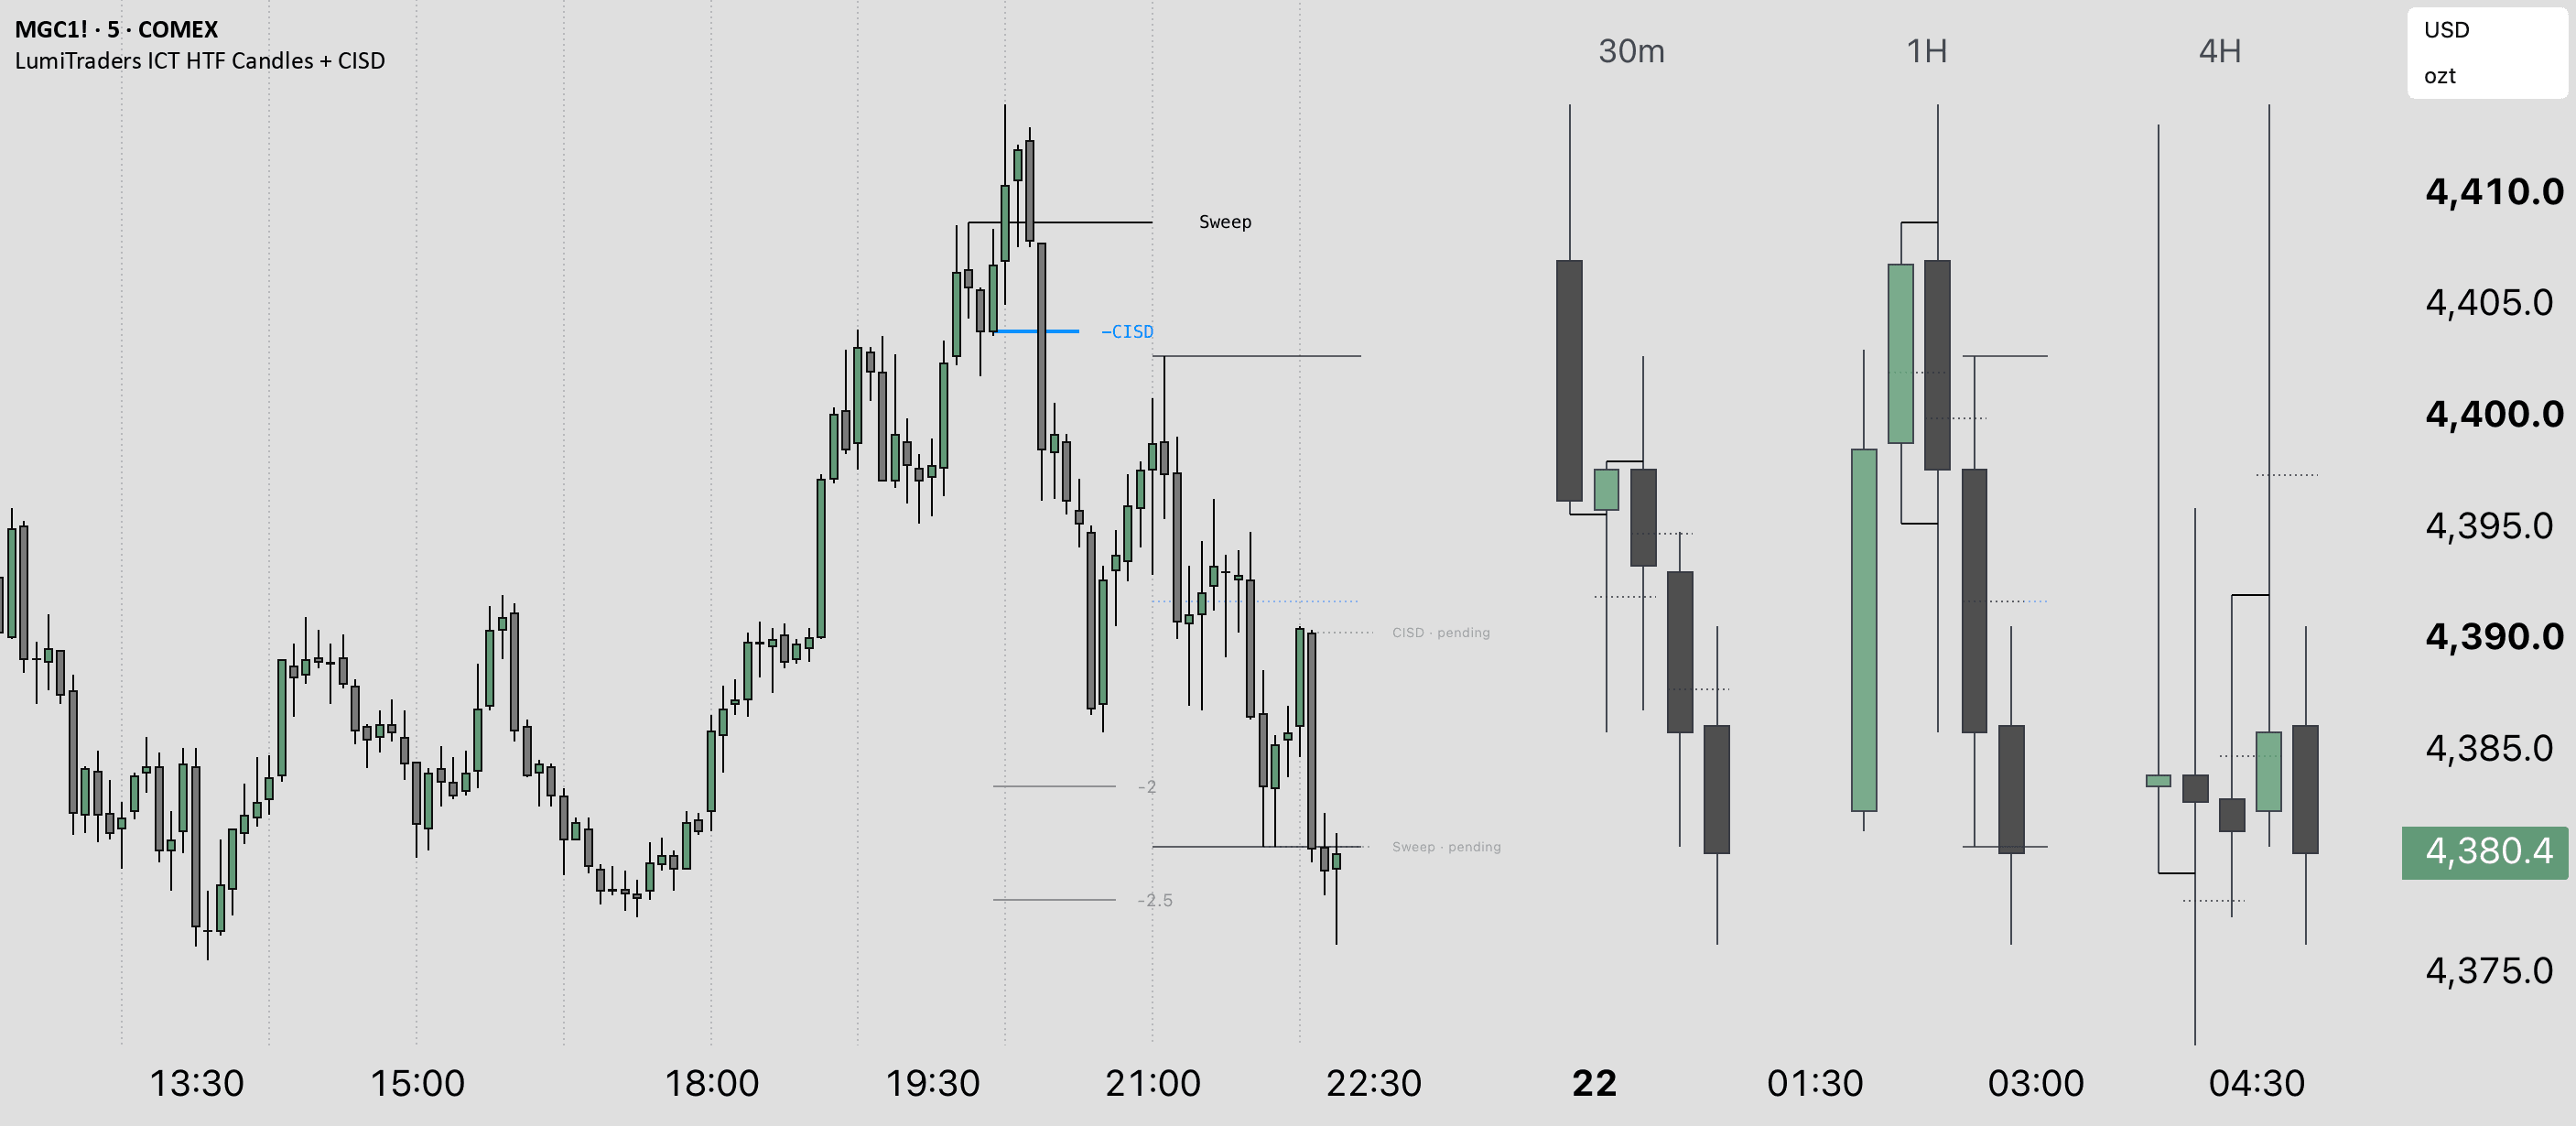
HTF structure & CISD
ICT HTF Candles + CISD
You want higher-timeframe candles beside the live chart, paired sweep and CISD reclaim levels, plus SMT and ICT projections.
Explore indicator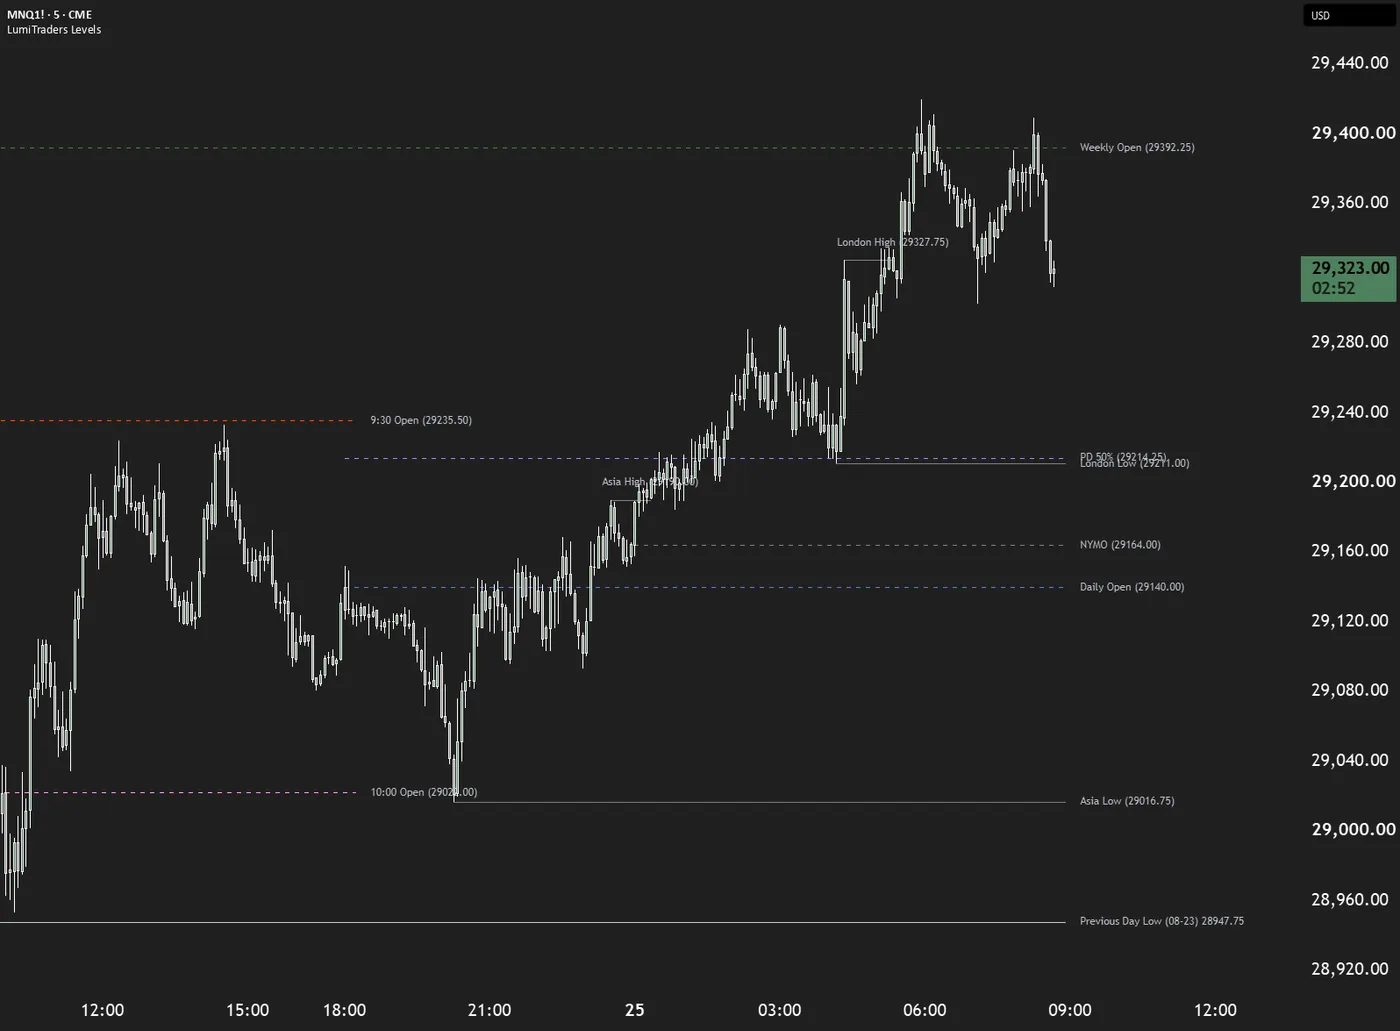
Sessions & reference levels
Key Levels
You want session highs and lows, period opens, range midpoints and equal highs or lows marked automatically on an intraday chart.
Explore indicatorReady when your chart is
Put the levels to work on your chart.
Learn the setup in the SPX RTH Gap lesson, then use the indicator to draw its reference levels.