Sessions & reference levels
Key Levels
Killzones, session pivots, period opens, previous-range midpoints and equal highs and lows — every reference level you draw by hand, built once and kept current on any intraday chart.
Free TradingView indicator by LumiTraders (opens in a new tab)
- Free to use
- Protected script
- No download
Opens the official script page. A free TradingView account is required.
- Platform
- TradingView · web & mobile
- Access
- Free · protected source
- Chart compatibility
- Intraday for sessions and opening lines
- Latest script update
01 / Overview
What this indicator does
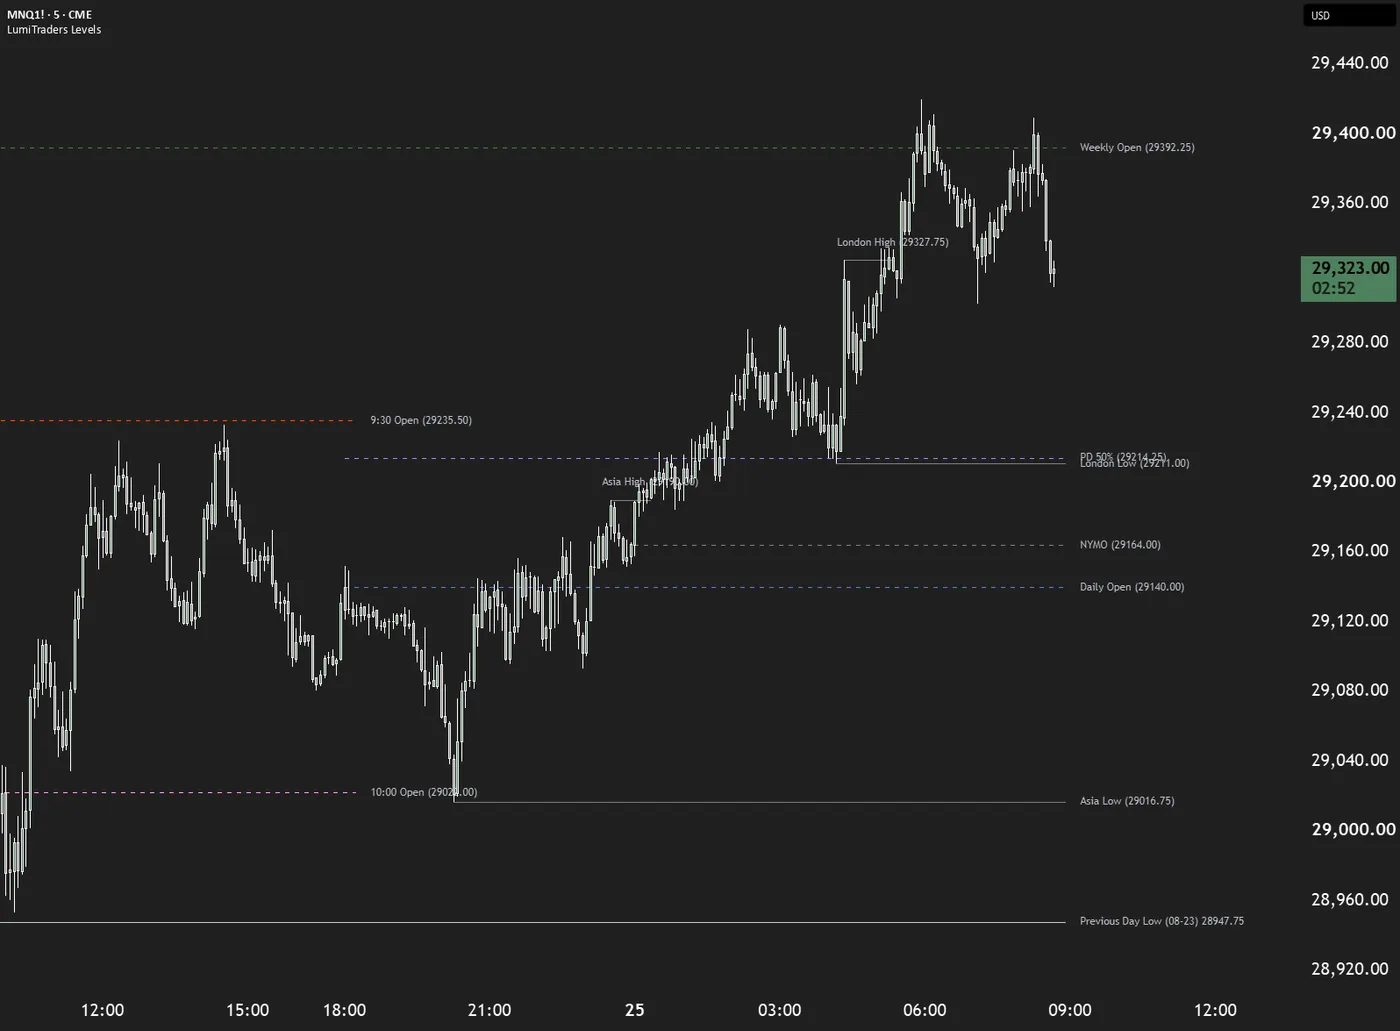
LumiTraders Key Levels is a free TradingView indicator that draws the reference points intraday traders mark by hand — killzone session ranges, session-high/low pivots with mitigation tracking, daily/weekly/monthly opens, previous-range midpoints, intraday anchors like the midnight and 9:30 opens, custom levels and equal highs and lows.
Use it when
You want session highs and lows, period opens, range midpoints and equal highs or lows marked automatically on an intraday chart.
- Five killzone sessions
- Asia, London, NY AM, NY Lunch and NY PM each draw a box that tracks the session's high and low as it develops, with an editable time window, box color and positionable in-box text — the killzone framing is a starting point, not a fixed schedule.
- Session pivots with mitigation
- Each session's high and low extend forward as levels until price trades through them, from the most recent session only or from every stored session, with optional range midpoints that can stop once tapped.
- Daily, weekly and monthly anchors
- Period opens and the 50% midpoint of the previous day, week and month range are drawn and extended right, all renameable and individually colored — and they stay on the chart when you zoom out.
- Intraday opens
- The midnight open (NYMO), 9:30 open and 10:00 open are drawn as their own lines, each with an editable time, so the common intraday anchors are on the chart without manual marking.
- Custom levels and windows
- Four custom opening-price lines and four custom session boxes take a name, time window and color — for news times, personal windows or a broker-specific open — and boxes can project their high and low forward.
- Equal highs and lows
- Swing-based detection pairs highs or lows that sit within a set number of ticks of each other — a fixed tolerance, not a percentage — with an optional shaded zone and automatic removal once price trades through the level.
Daily, weekly and monthly boundaries follow the exchange session. The midnight open is a separate line, so it can differ from the daily open on futures charts.
02 / Get started
Add it to your TradingView chart
Save it once. Find it in your favorites on desktop and mobile.
Save the script
Open the script page on TradingView and select Add to favorites. Sign in to your TradingView account first; a free account is enough.
Open a compatible chart
Intraday for sessions and opening lines. Choose the instrument and timeframe you want to study.
Add it from your favorites
Select Indicators → Favorites → LumiTraders Key Levels. The indicator draws directly on your chart. Open its settings to adjust the display.
Session boxes and opening-price lines need an intraday chart; the daily, weekly and monthly levels are built to survive zooming out.
03 / Configuration
Settings, explained
Start with the session or timeframe, then choose which drawings you want to keep on the chart.
Setting names are paraphrased from the published description. Open the script settings on TradingView for the exact labels.
| Setting | What it changes |
|---|---|
| General | |
| Timezone | All session times are interpreted in this timezone. Named zones like America/New_York follow Daylight Saving Time; the GMT options do not. |
| Session drawing limit | How many of each drawing type are kept on the chart. Lower keeps things clean; several sections have an Unlimited override. |
| Timeframe limit | Session drawings hide at or above this timeframe. The LumiTraders key levels and Custom sections deliberately ignore it so higher-timeframe anchors survive zooming out. |
| Drawing cutoff time | Stops pivots and open lines extending at a set time, so yesterday's levels don't run into today. |
| Killzones | |
| Session windows and colors | Per session: time window, box color and text color. Box text can be positioned horizontally and vertically, sized independently, and colored directly or as a faded version of the box color. |
| Killzone pivots | |
| Extension and mitigation | Extend each session high and low until mitigated or continue past mitigation; draw from the most recent session only or from every stored session. |
| Midpoints and labels | Optional midpoints per session range with a stop-once-tapped switch. Labels sit at the level or track the right edge, flip direction once a level is broken, can show the price, and are fully renameable. |
| Key levels | |
| Period opens and midpoints | Daily, weekly and monthly opens plus the 50% of each previous period's range, individually toggled, renamed and colored. |
| Intraday opens | Midnight (NYMO), 9:30 and 10:00 open lines, each with an editable anchor time. |
| Custom levels | |
| Lines and session boxes | Four opening-price lines and four session boxes with a name field, time window and color; boxes can project their high and low forward as extended lines. |
| Equal highs & lows | |
| Detection and cleanup | Adjustable swing lookback, maximum tick distance between the paired swings, optional shaded zone between them, and automatic removal once price trades through. |
| Day / Week / Month | |
| Structure markers | Period opens, previous highs and lows, and vertical separators per timeframe. Day-of-week labels can sit at the top or bottom of the chart, anchored to midnight or midday. |
| Timestamps | |
| Vertical lines | Up to four vertical lines at times of your choosing — news releases, session transitions, or any recurring moment worth a visual anchor. |
04 / Reference
Alerts and limitations
Know what triggers an alert and which chart conditions affect the drawings.
Available alerts
- Session pivot traded through
- Price trades through any killzone session's high or low.
- Previous high or low broken
- The previous day, week or month high or low is broken.
Before you use it
- Daily, weekly and monthly levels use the exchange session for period boundaries — on CME futures the "daily" open is the 18:00 ET session open, not midnight. The NYMO line is the midnight-anchored version.
- Session boxes and opening-price lines require an intraday chart.
- Drawings are capped by the session drawing limit and TradingView's own drawing budget; long histories drop the oldest sessions first.
- GMT timezone options do not adjust for Daylight Saving Time — prefer named zones like America/New_York.
A few useful answers
Frequently asked questions
Is the LumiTraders Key Levels indicator free?
Yes. It is a free, protected-source script on TradingView. Sign in to a TradingView account to add it to your chart. TradingView's plan limits, market-data access and drawing limits still apply.
How do I add it to my TradingView chart?
Open the script page on TradingView and click Add to favorites (you need to be signed in). Then open an intraday chart and choose Indicators › Favorites › LumiTraders Key Levels. There is no download; the indicator runs inside TradingView, including the mobile app.
What is a killzone?
A recurring session window — the indicator ships with Asia, London, NY AM, NY Lunch and NY PM, and draws each as a box tracking the session's high and low. Every window is editable, so the killzone framing is just a starting point: set them to whatever sessions you actually trade.
Why is the daily open not at midnight?
Period boundaries follow the exchange session, so on CME futures the daily open is the 18:00 ET session open. The midnight-anchored open is its own line — NYMO — with an editable time.
How are equal highs and lows detected?
Swing-based detection pairs two highs or two lows that sit within a set number of ticks of each other. The tolerance is ticks — not a percentage or an ATR fraction — so it means the same thing on every chart you load the indicator on. Levels are removed automatically once price trades through them.
Is the source code open?
The script is published as protected source. It is built on the open-source ICT Killzones & Pivots [TFO] by tradeforopp, used and modified under the Mozilla Public License 2.0, with the original license header retained — the additions include the LumiTraders key levels and custom levels sections, equal high/low detection and per-session box text controls.
Does it generate buy or sell signals?
No. The indicator draws reference levels only — session ranges, opens, midpoints and equal highs/lows. Nothing in it is a signal or trading advice.
Release notes
Version history
Script updates published on TradingView, newest first.
Updated previous-day high/low (PDH/PDL) handling.
Added a No Wick Candle option and refined its settings.
Published on TradingView.
Source and authorship
This guide documents LumiTraders Key Levels by LumiTraders, published on TradingView on . The script page is the source for the features, settings and release notes above.
Read the official TradingView description (opens in a new tab)Built on the open-source ICT Killzones & Pivots [TFO] by tradeforopp, used and modified under the Mozilla Public License 2.0.
Educational tool, not financial advice. LumiTraders is the education brand of the Funded.Now team. TradingView is a trademark of TradingView, Inc.
Build your chart
Explore the other indicators
RTH gaps & Fibonacci
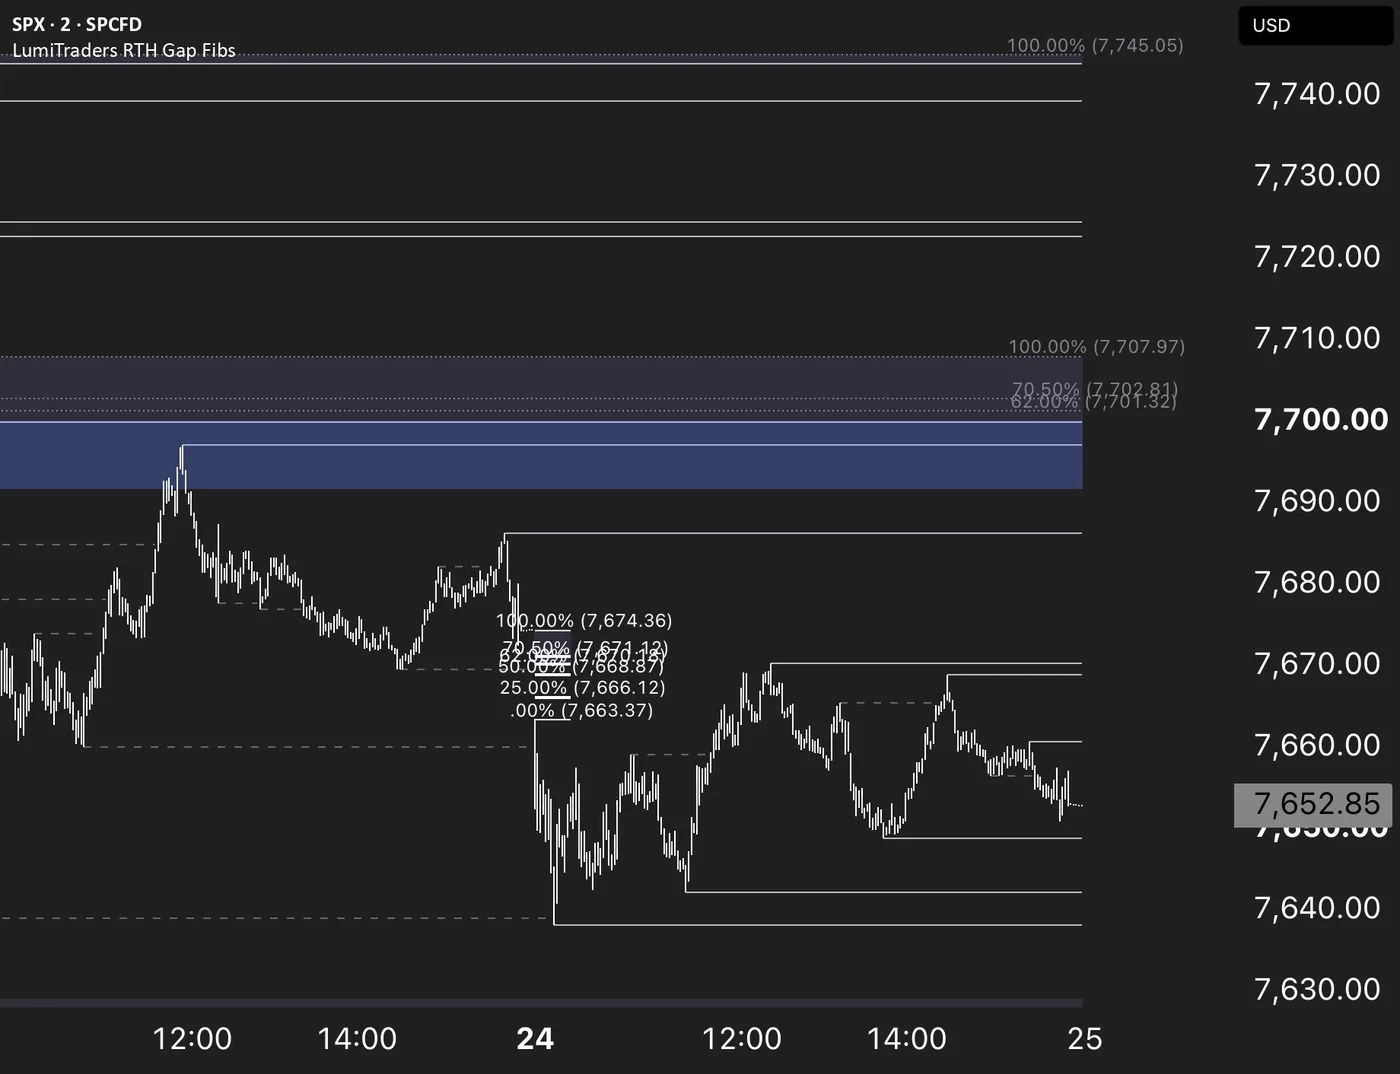
SPX RTH Gap with Fibonacci
You want to map the gap from the prior regular-session close to the next open, then track which Fibonacci levels remain unfilled.
Explore indicator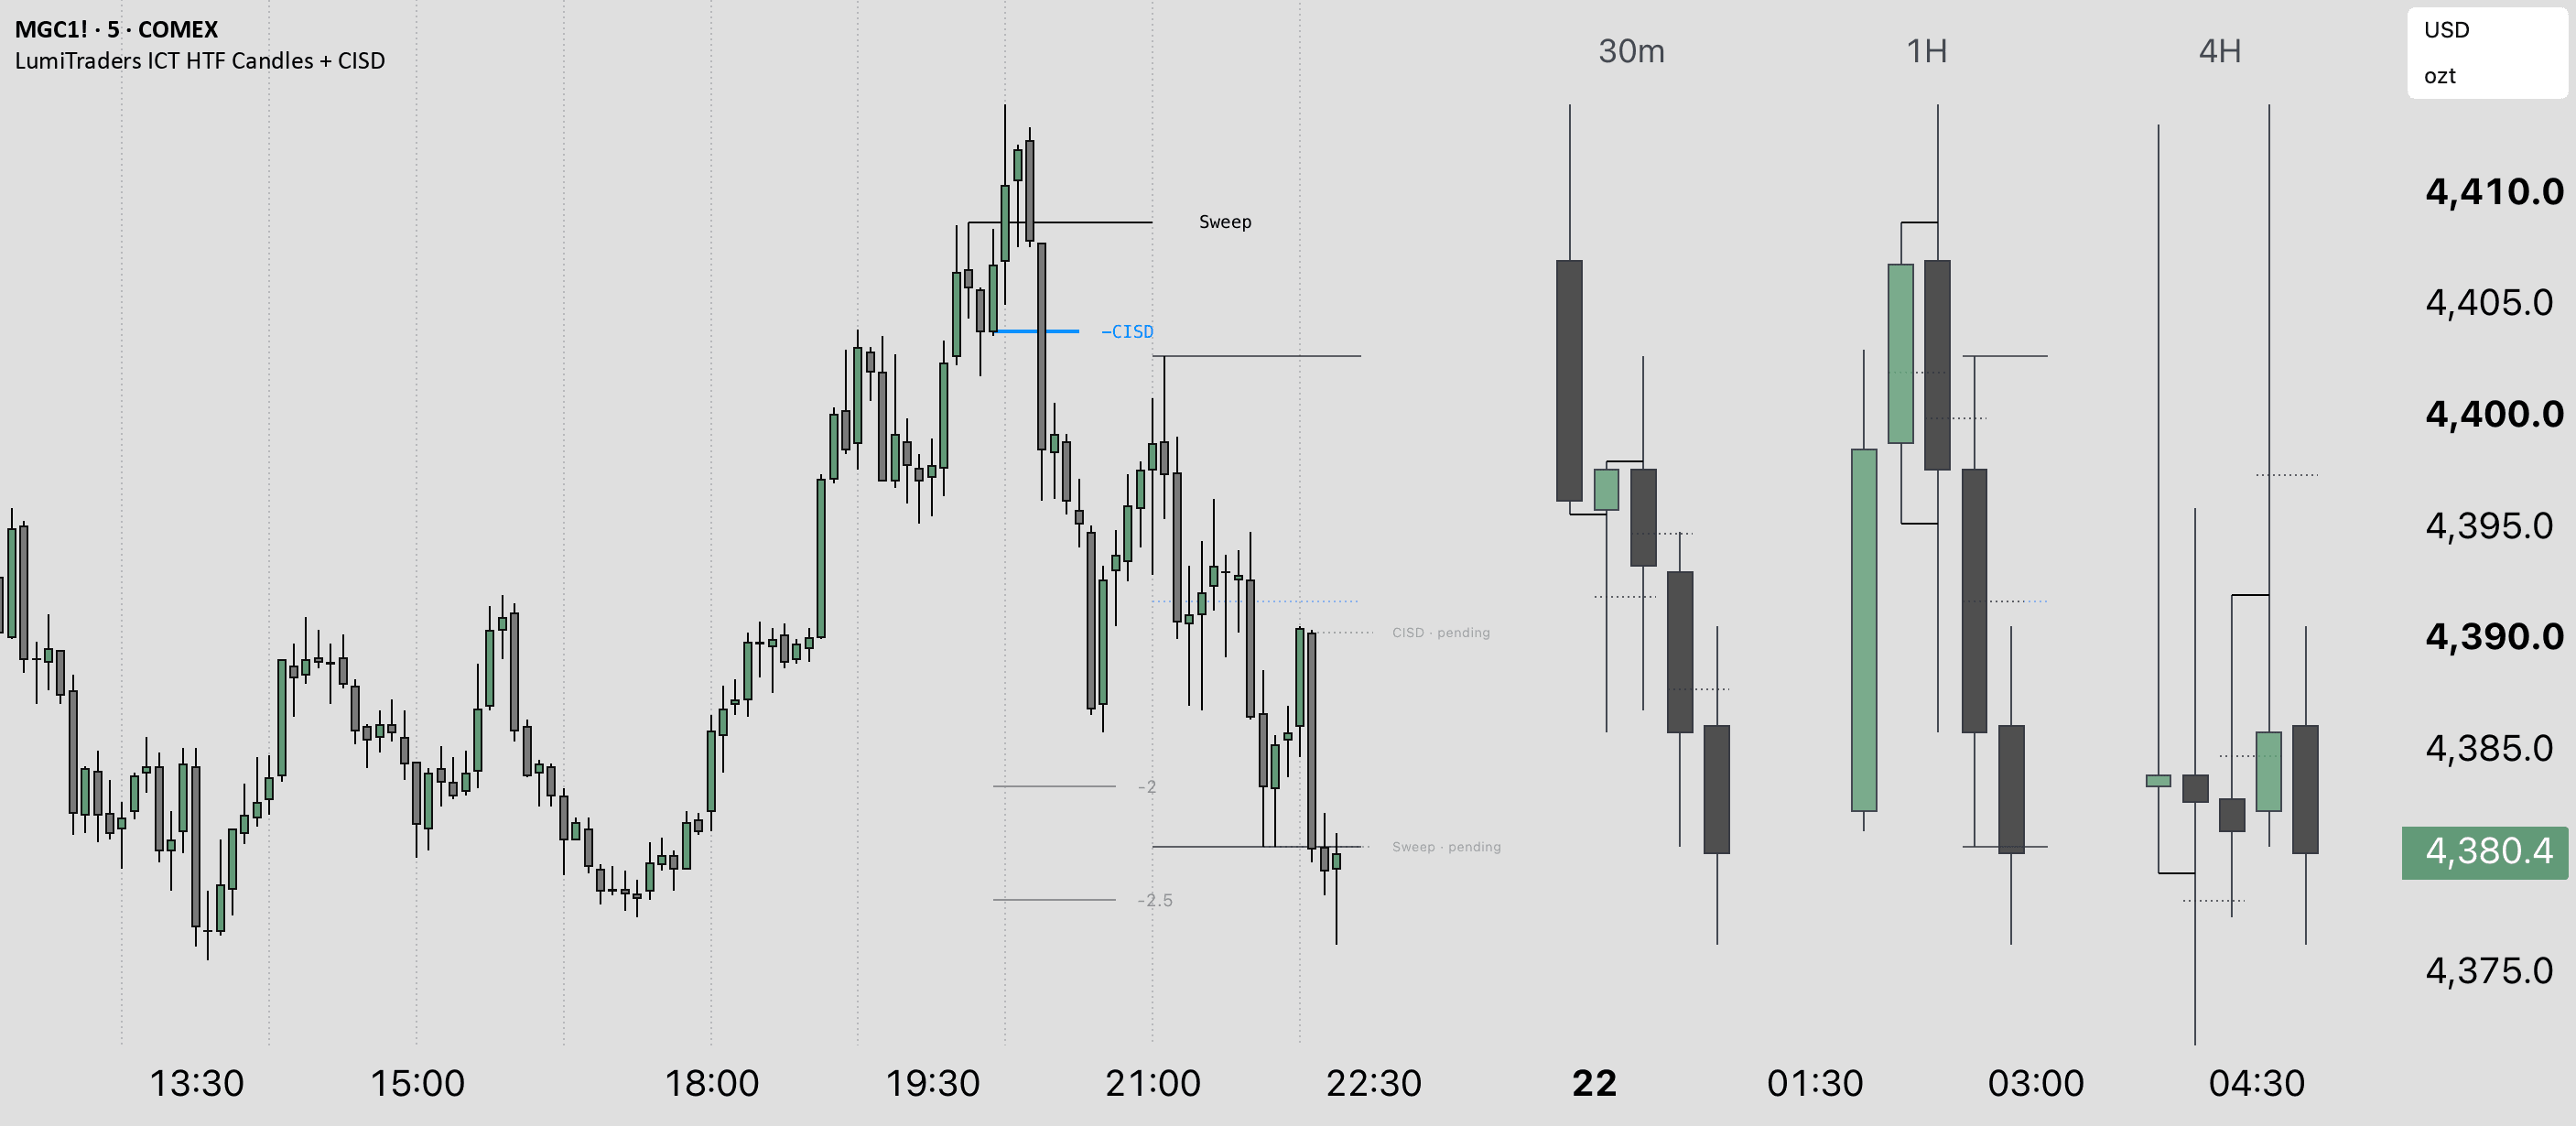
HTF structure & CISD
ICT HTF Candles + CISD
You want higher-timeframe candles beside the live chart, paired sweep and CISD reclaim levels, plus SMT and ICT projections.
Explore indicatorReady when your chart is
Put the levels to work on your chart.
Add the indicator to your TradingView favorites, set your chart preferences, and explore the structure it draws.