HTF structure & CISD
ICT HTF Candles + CISD
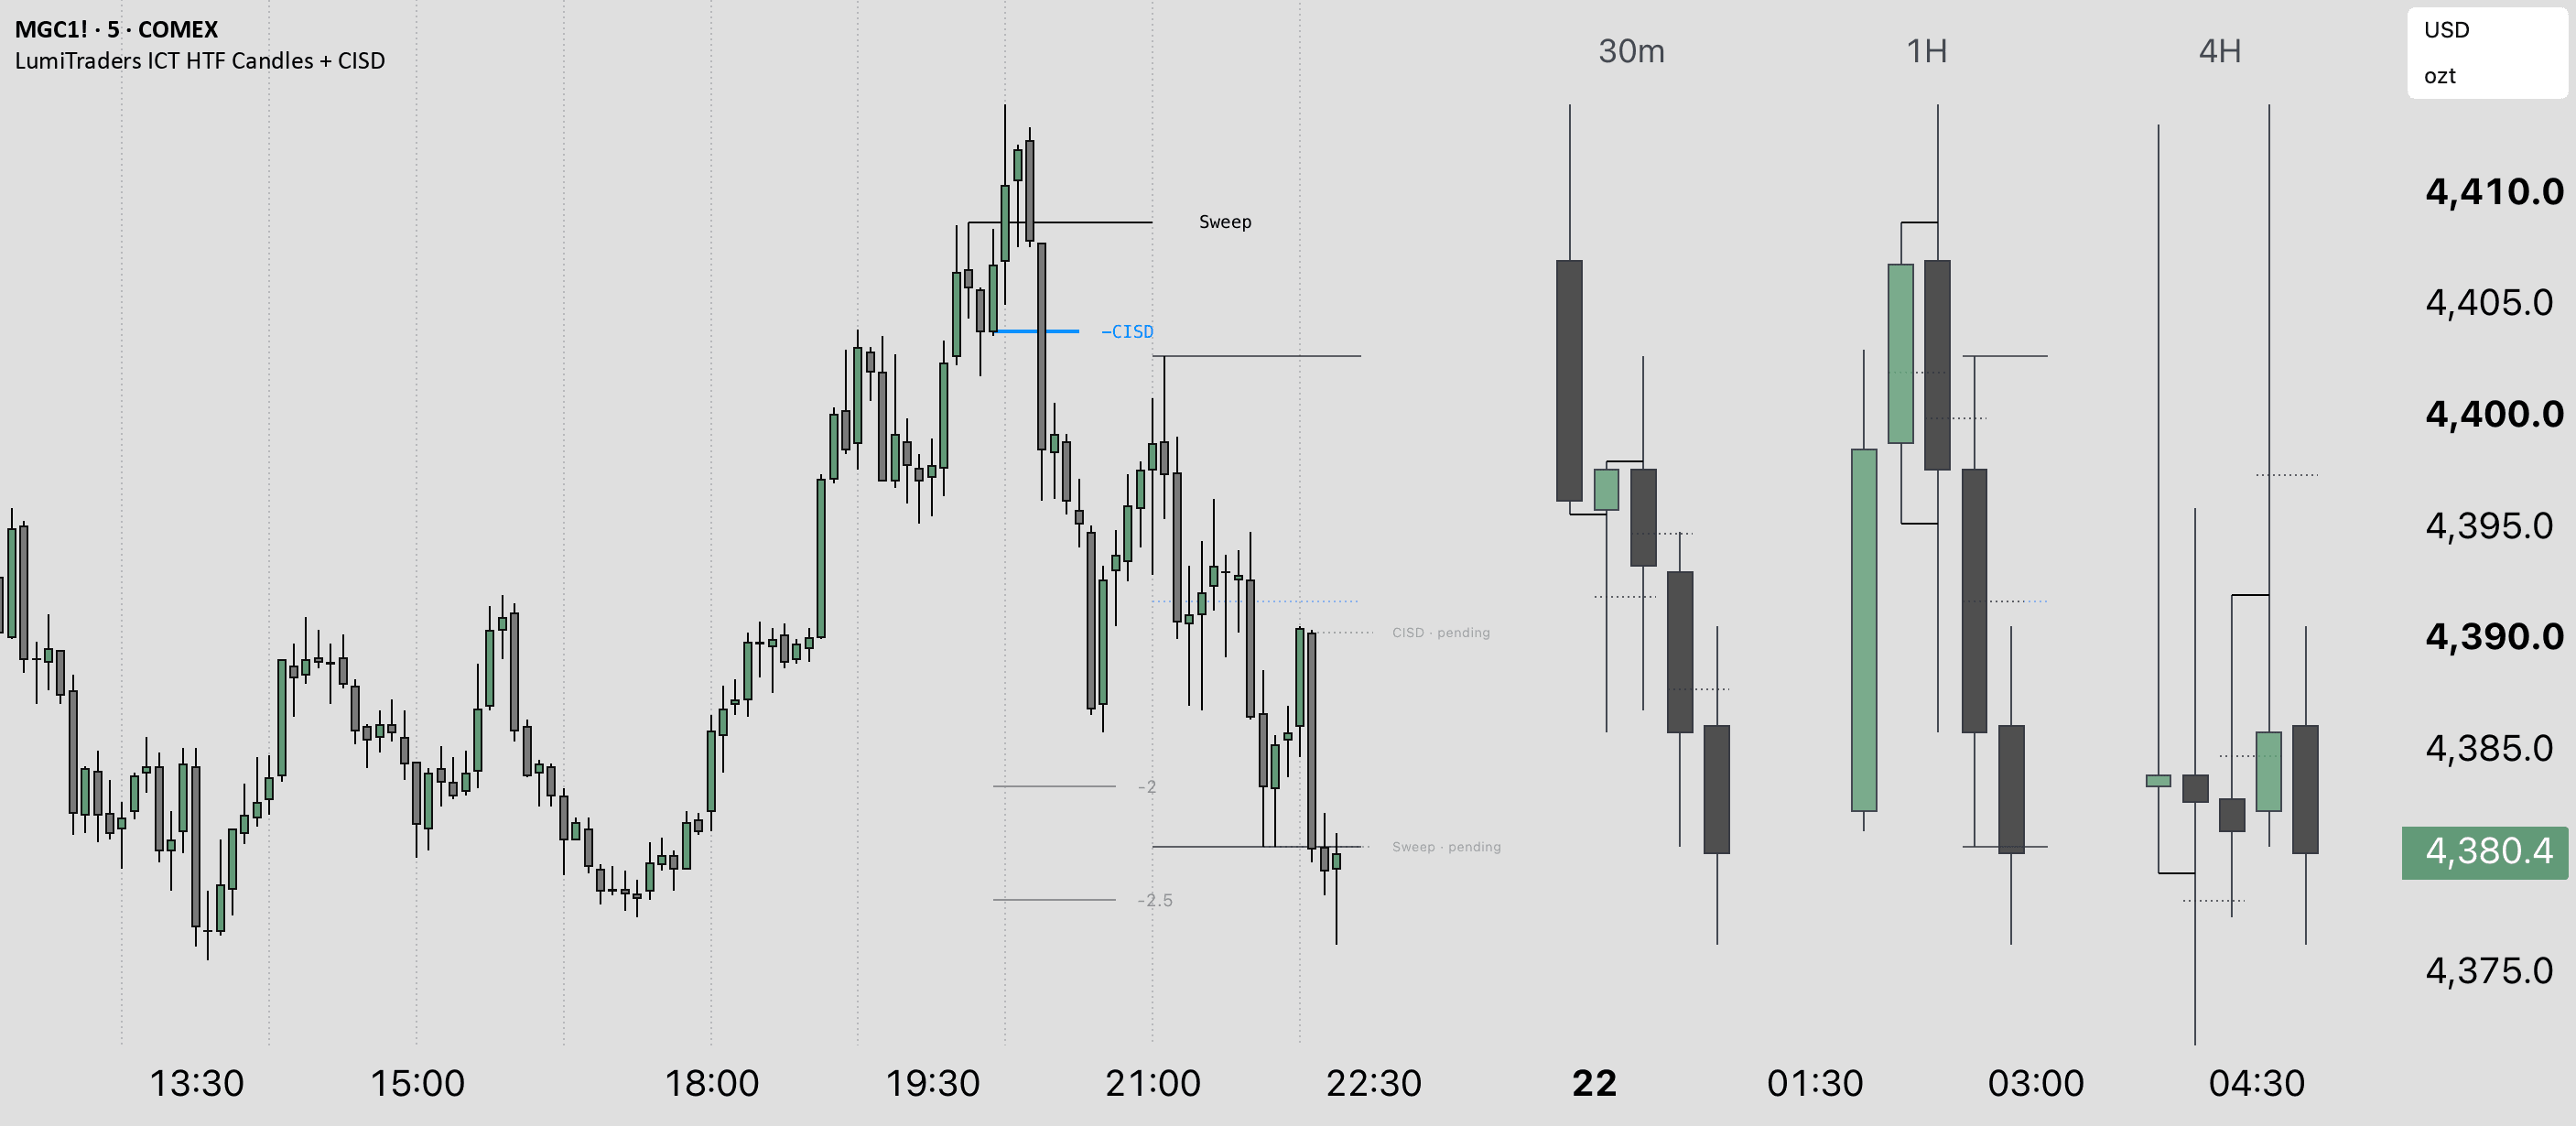
Higher-timeframe candles with multi-timeframe SMT, ICT projections and CISD levels — now with retest, Early CISD and possible CISD/sweep labels on the chart.
Free TradingView indicator by LumiTraders (opens in a new tab)
- Free to use
- Protected script
- No download
Opens the official script page. A free TradingView account is required.
- Platform
- TradingView · web & mobile
- Access
- Free · protected source
- Chart compatibility
- Even timeframe pairs, such as 5m / 1H
- Latest script update
01 / Overview
What this indicator does
LumiTraders ICT HTF Candles + CISD is a free TradingView indicator that combines up to six higher-timeframe candle sets with sweep and CISD reclaim levels, multi-timeframe SMT, SMT on HTF candles, ICT projections, and retest, Early CISD and possible CISD/sweep labels on the chart.
Use it when
You want higher-timeframe candles beside the live chart, paired sweep and CISD reclaim levels, plus SMT and ICT projections.
- Six HTF candle sets
- Up to six sets of higher-timeframe candles are drawn to the right of price, each with its own timeframe and candle count, with day-of-week labels, candle time labels, remaining-time readout and a timezone selector.
- Automatic timeframe pairing
- The chart timeframe selects its partner HTF automatically — 5m pairs to 1H, 15m to 4H, and so on, all editable — and the same pairing drives the drawn candles, the vertical boundary lines, the projected levels and the CISD model.
- FVGs, imbalances and sweeps
- Fair Value Gaps and Volume Imbalances are marked on the HTF candles with an optional Consequent Encroachment line at each gap's 50%, and sweep lines mark a candle level a later candle traded through — optionally only true raids where the sweeping candle closed back inside.
- Projected previous-candle levels
- The previous HTF candle's high, low and 50% midpoint are projected back onto the live chart and restyled once the forming HTF candle trades through them, scoped to the paired timeframe, the highest, the lowest, or all.
- Close-confirmed CISD
- When an HTF candle sweeps the previous candle's low but closes back above it, the extreme open of the opposing run on the chart timeframe becomes the CISD level, drawn with its 50% once a candle closes back through it — the mirror case marks bearish setups.
- Early detection and invalidation
- Early CISD watches the same reclaim on the chart timeframe while the HTF candle is still forming and is replaced by the confirmed line on close; a close through the 50% recolors a setup under pressure, and a close through the far side removes it — both measured on closes, never wicks.
- Multi-timeframe SMT and ICT projections
- SMT includes a multi-timeframe option and support for HTF candles. ICT projections accompany the candle and CISD tools; the September 22 release further improves SMT.
- Chart sweeps and setup labels
- Sweep lines extend to the lower chart timeframe. The latest release adds retest and Early CISD labels, plus labels for possible CISD and sweeps on that timeframe.
Early CISD is provisional while the higher-timeframe candle forms. A confirmed setup uses the completed candle; keep that distinction in view when reading the drawings.
02 / Get started
Add it to your TradingView chart
Save it once. Find it in your favorites on desktop and mobile.
Save the script
Open the script page on TradingView and select Add to favorites. Sign in to your TradingView account first; a free account is enough.
Open a compatible chart
Even timeframe pairs, such as 5m / 1H. Choose the instrument and timeframe you want to study.
Add it from your favorites
Select Indicators → Favorites → LumiTraders ICT HTF Candles + CISD. The indicator draws directly on your chart. Open its settings to adjust the display.
Pick a chart timeframe that divides evenly into the paired higher timeframe — 5m under 1H, 15m under 4H — or the candle sets won't draw.
03 / Configuration
Settings, explained
Start with the session or timeframe, then choose which drawings you want to keep on the chart.
Setting names are paraphrased from the published description. Open the script settings on TradingView for the exact labels.
| Setting | What it changes |
|---|---|
| Pairing | |
| Pair timeframes | The backbone. The chart timeframe is matched against this list and the result drives the drawn candles, vertical lines, projected levels and the CISD model. Off or unmatched, each of those falls back to its own timeframe setting. |
| HTF candles | |
| Candle sets | Up to six sets, each with its own timeframe and candle count. 50% lines of previous HTF candles can be drawn directly on a set for as many candles back as you want. |
| Boundaries and traces | Vertical lines at HTF candle boundaries, following the pairing or a fixed timeframe, and trace lines connecting each HTF candle's open, high, low and close back to where it happened on your chart. |
| CISD | |
| Bias | Restricts the model to long setups only, short only, or both. |
| History | How many past setups stay drawn. Default is one, which keeps the chart clean. |
| CISD line length | How far past the confirmation candle the lines are drawn. |
| Max CISD age | A level is only used if the candle that formed it is recent enough — guards against an old sweep anchoring a line thousands of bars back. |
| Delete when invalidated | On, invalidated lines are removed; off leaves them drawn until History pushes them off, if you want to review what failed. |
| SMT | |
| Multi-timeframe SMT | Adds an option to use SMT across multiple timeframes. The release notes do not specify its default timeframes or comparison symbols. |
04 / Reference
Alerts and limitations
Know what triggers an alert and which chart conditions affect the drawings.
Before you use it
- Higher-timeframe data is requested with lookahead enabled; the model samples it at the HTF candle's close, so confirmed setups are evaluated against completed candles, but the request itself is not a lookahead-free one.
- Early CISD is provisional by design — it draws on a level that has not been confirmed by an HTF close, and the forming bar can still change.
- HTF candle sets and CISD lines share TradingView's 500-line and 500-box budget; with six timeframes, sweeps, levels and vertical lines all enabled, drawings can start disappearing. Reduce candle counts or enabled timeframes.
- Levels and candle sets only draw on chart timeframes that divide evenly into the selected higher timeframe.
A few useful answers
Frequently asked questions
Is the ICT HTF Candles + CISD indicator free?
Yes. It is a free, protected-source script on TradingView. Sign in to a TradingView account to add it to your chart. TradingView's plan limits, market-data access and drawing limits still apply.
How do I add it to my TradingView chart?
Open the script page on TradingView and click Add to favorites (you need to be signed in). Then choose Indicators › Favorites › LumiTraders ICT HTF Candles + CISD. There is no download; the indicator runs inside TradingView, including the mobile app.
What changed in the September 22, 2026 update?
Early CISD was updated and SMT improved. The release adds retest and Early CISD labels, plus possible CISD and sweep labels on the lower chart timeframe, and credits MountainDude. Earlier September releases added multi-timeframe SMT, SMT on HTF candles and chart-timeframe sweep lines. The linked TradingView description and chart labels are in English.
What is a CISD?
A Change In State of Delivery. The model looks for an HTF candle that takes out the previous candle's low but closes back above it (a swept low; the mirror for highs is the bearish case). The extreme open of the opposing run that built the sweep candle is the CISD level — the price delivery has to reclaim — and the setup is confirmed when a candle closes back through it. Two lines are drawn: the reclaim level and its 50%.
How is it different from other HTF candle tools?
Most HTF candle tools stop at drawing the candles, and most CISD tools run on their own timeframe logic. Here the timeframe pairing that decides which candles are drawn is the same timeframe the CISD model is built from, so the levels on the chart always belong to the candles beside it.
How is it meant to be used?
Set the pairing and let the chart timeframe pick the fractal: drop to 5m and you are reading 1H structure, drop to 1m and you are reading 15m. The HTF candles show where a sweep sits in context, the projected levels show what price is trading against, and the CISD lines mark where delivery changed. Once a setup is live, the 50% is the line to watch — a close through it is the first sign it is failing.
Why did some drawings disappear?
The HTF candle sets and the CISD lines share TradingView's 500-line and 500-box budget. With six timeframes, sweeps, levels and vertical lines all enabled the budget can run out and drawings drop. Reduce the candle counts, the vertical line maximum, or the number of enabled timeframes.
Is the source code open?
The script is published as protected source. It is built on ICT HTF Candles by fadi, used under the Mozilla Public License 2.0.
Does it generate buy or sell signals?
No. It is a tool for reading structure — HTF context, sweeps and reclaim levels. Nothing in it is a signal or trading advice.
Release notes
Version history
Script updates published on TradingView, newest first.
Updated Early CISD and improved SMT. Added retest and Early CISD labels, plus possible CISD and sweep labels on the chart timeframe. Credit to MountainDude.
Added SMT for HTF candles and a sweep line on the chart timeframe; improved Early CISD.
Updated SMT and CISD; added a multi-timeframe SMT option and a sweep line on the lower timeframe (LTF).
Added SMT and ICT projections and improved CISD.
Published on TradingView.
Source and authorship
This guide documents LumiTraders ICT HTF Candles + CISD by LumiTraders, published on TradingView on . The script page is the source for the features, settings and release notes above.
Read the official TradingView description (opens in a new tab)Built on ICT HTF Candles by fadi, used under the Mozilla Public License 2.0. The September 22 update also credits MountainDude.
Educational tool, not financial advice. LumiTraders is the education brand of the Funded.Now team. TradingView is a trademark of TradingView, Inc.
Build your chart
Explore the other indicators
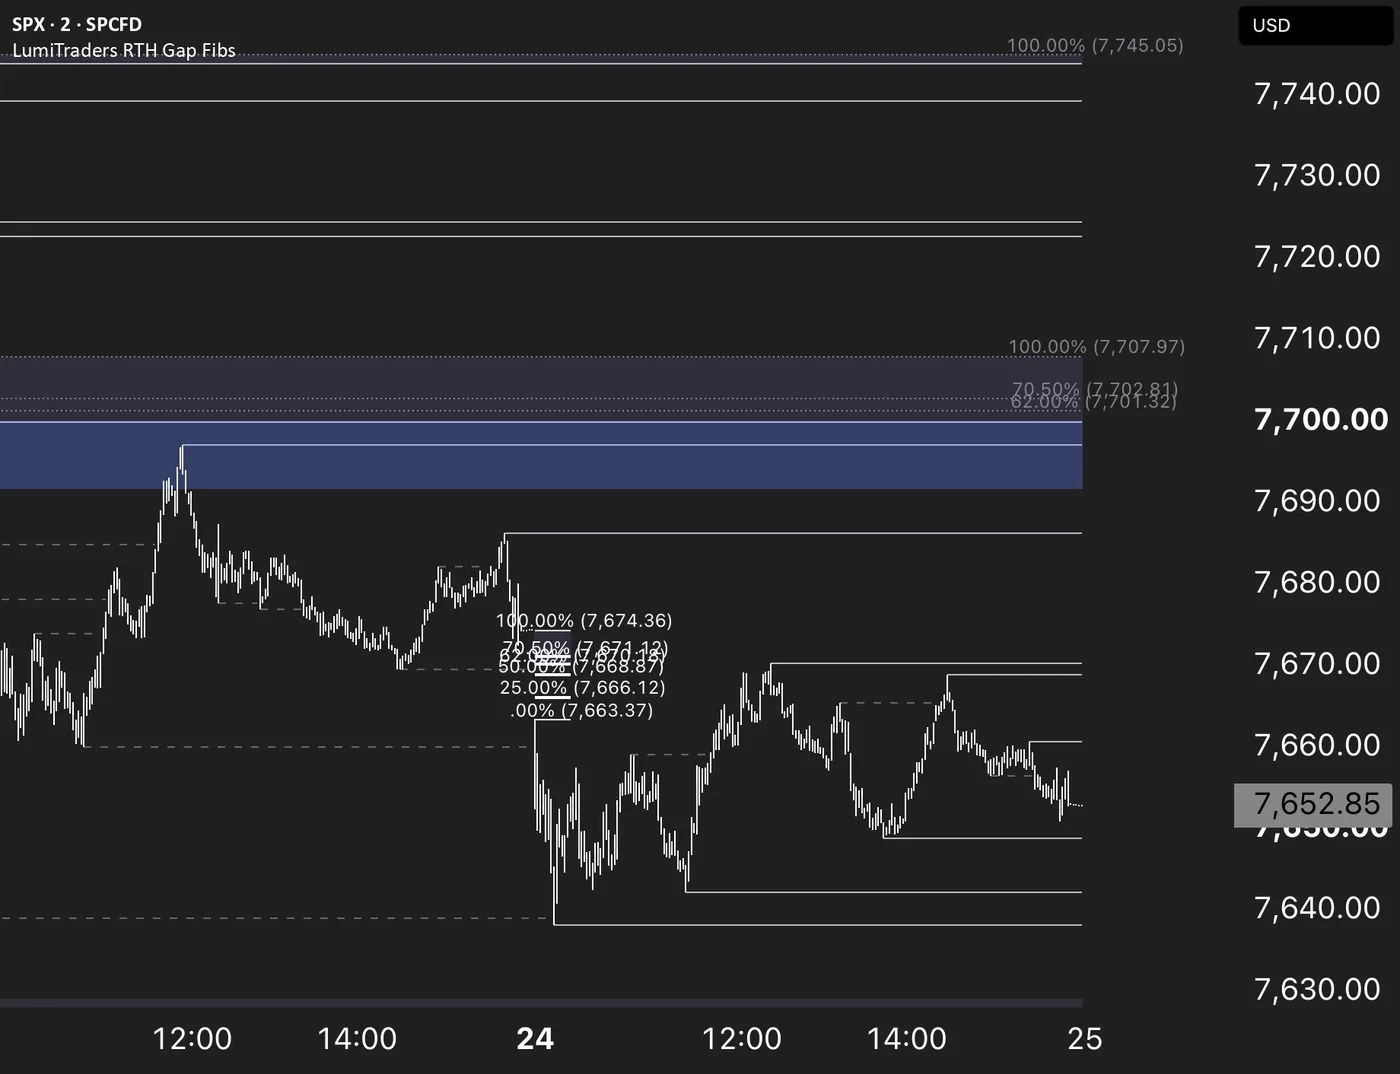
RTH gaps & Fibonacci
SPX RTH Gap with Fibonacci
You want to map the gap from the prior regular-session close to the next open, then track which Fibonacci levels remain unfilled.
Explore indicator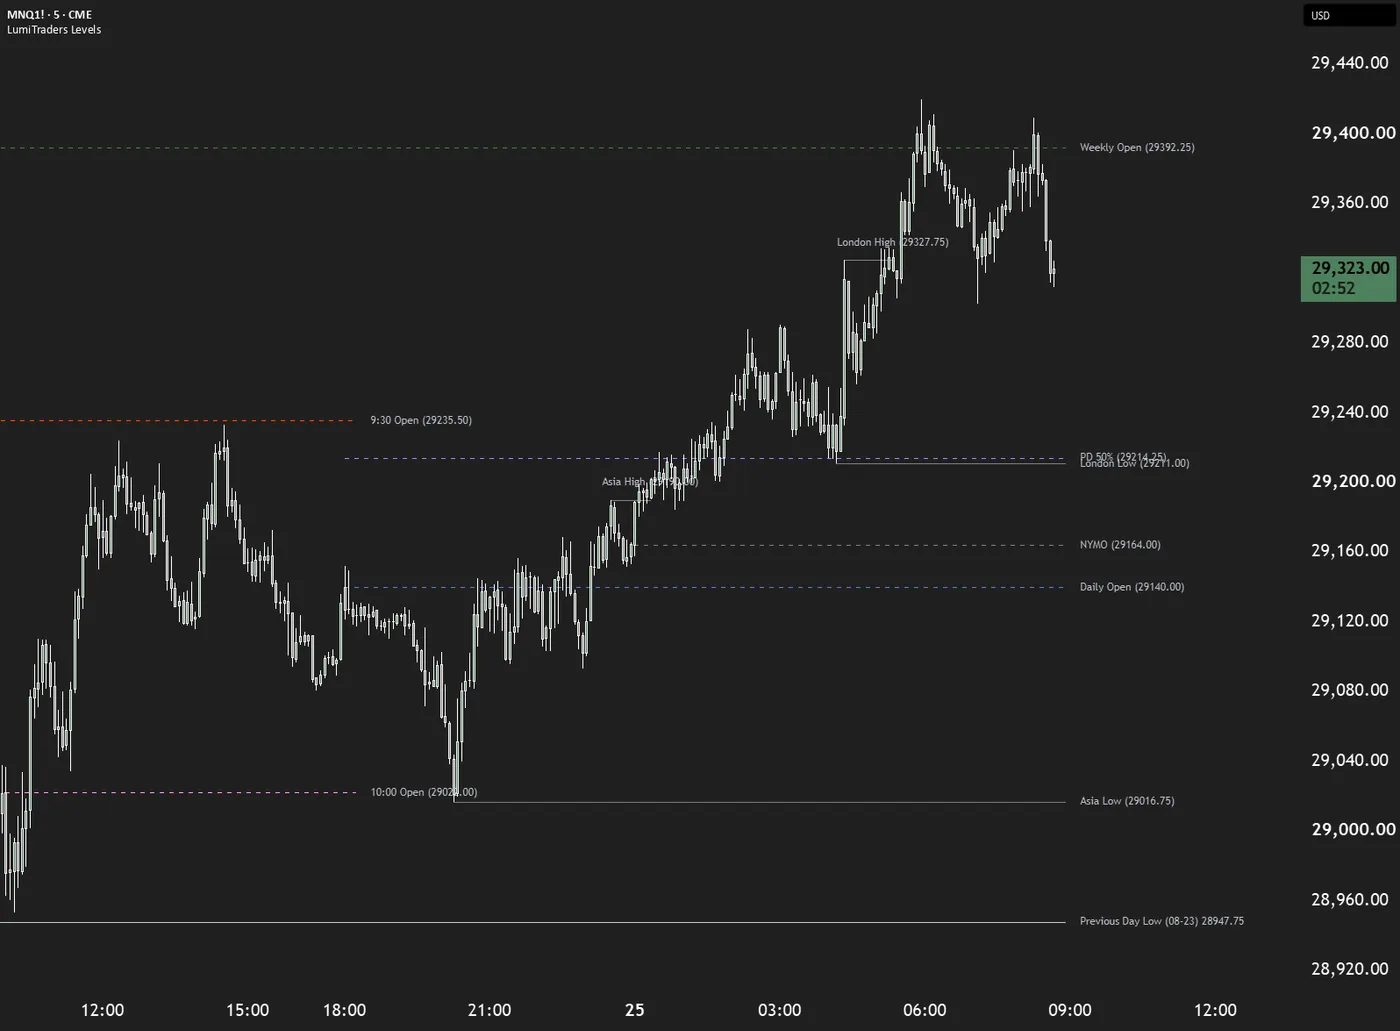
Sessions & reference levels
Key Levels
You want session highs and lows, period opens, range midpoints and equal highs or lows marked automatically on an intraday chart.
Explore indicatorReady when your chart is
Put the levels to work on your chart.
Add the indicator to your TradingView favorites, set your chart preferences, and explore the structure it draws.