Before you begin
What you’ll learn
- FVG
- Breakaway Gap
- Measuring Gap
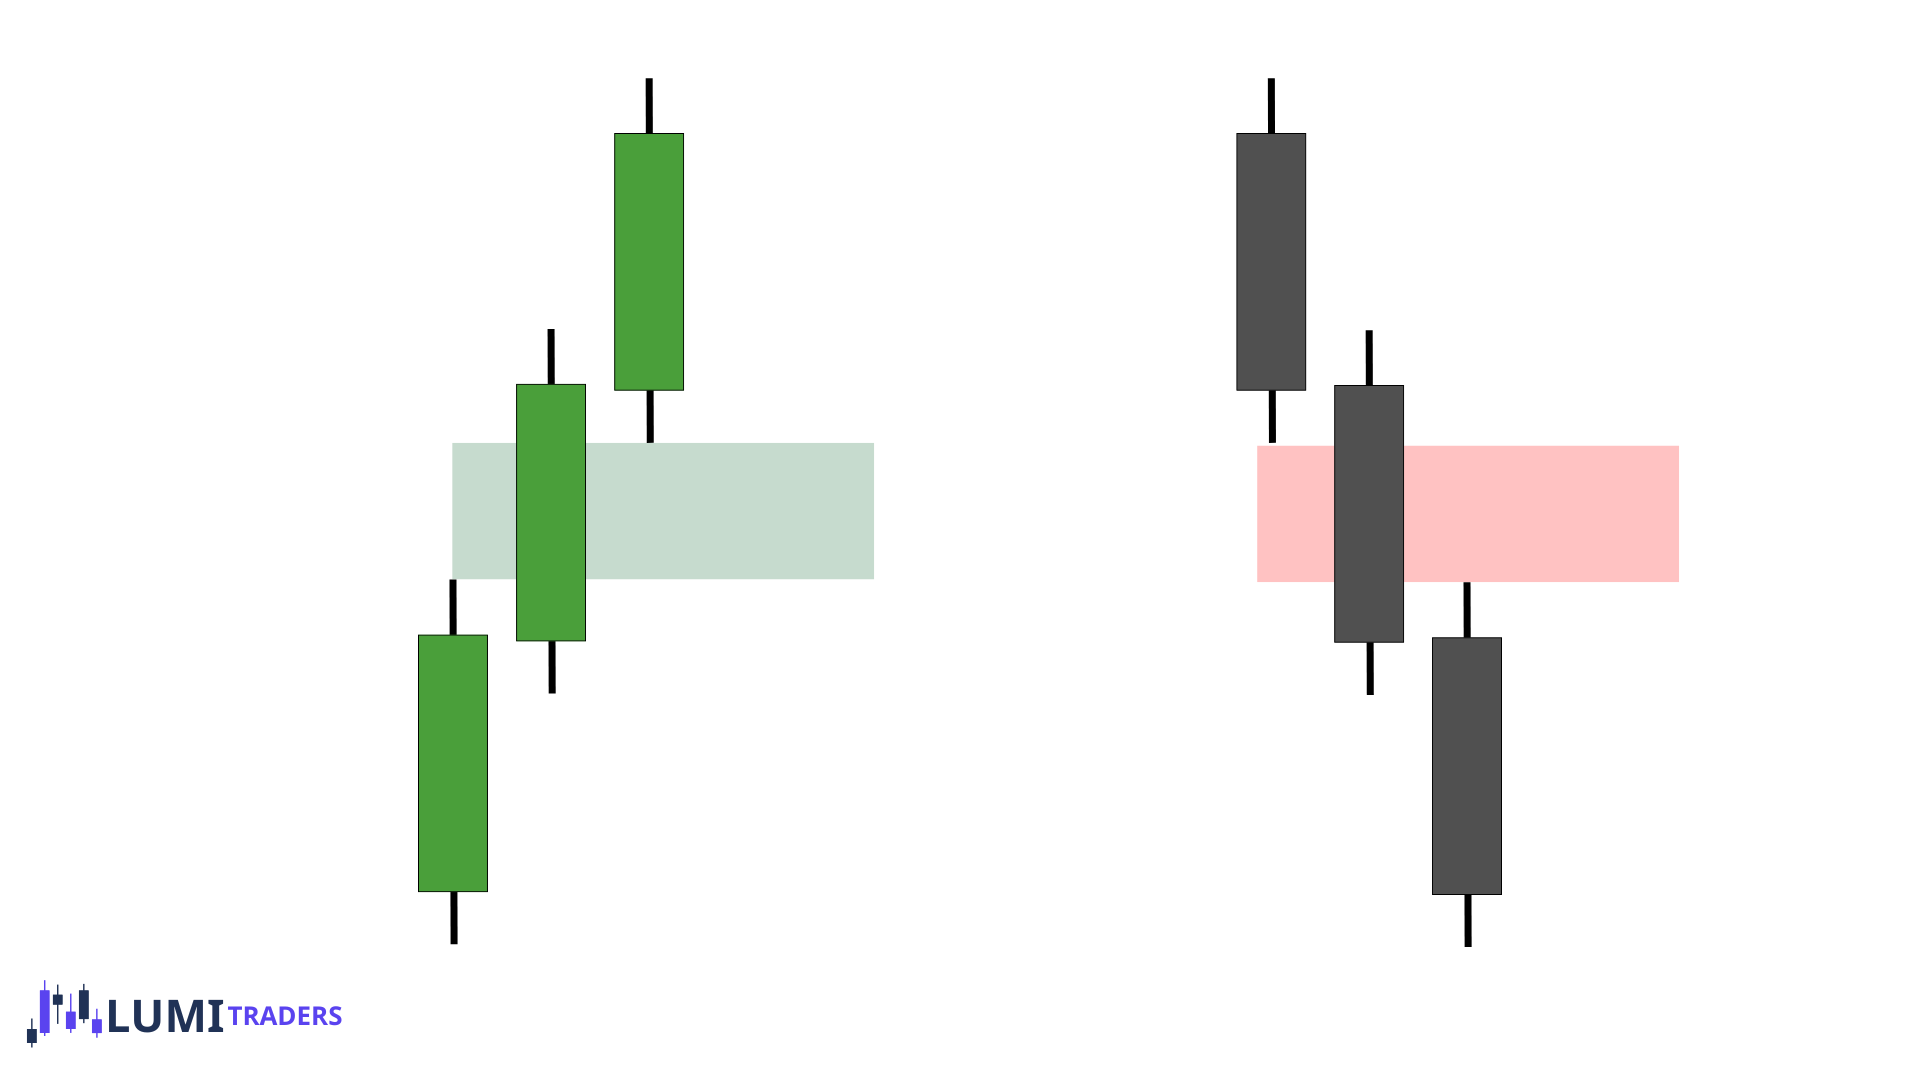
A Fair Value Gap (FVG) is a three-candlestick pattern that represents an imbalance in the market caused by aggressive buying or selling.
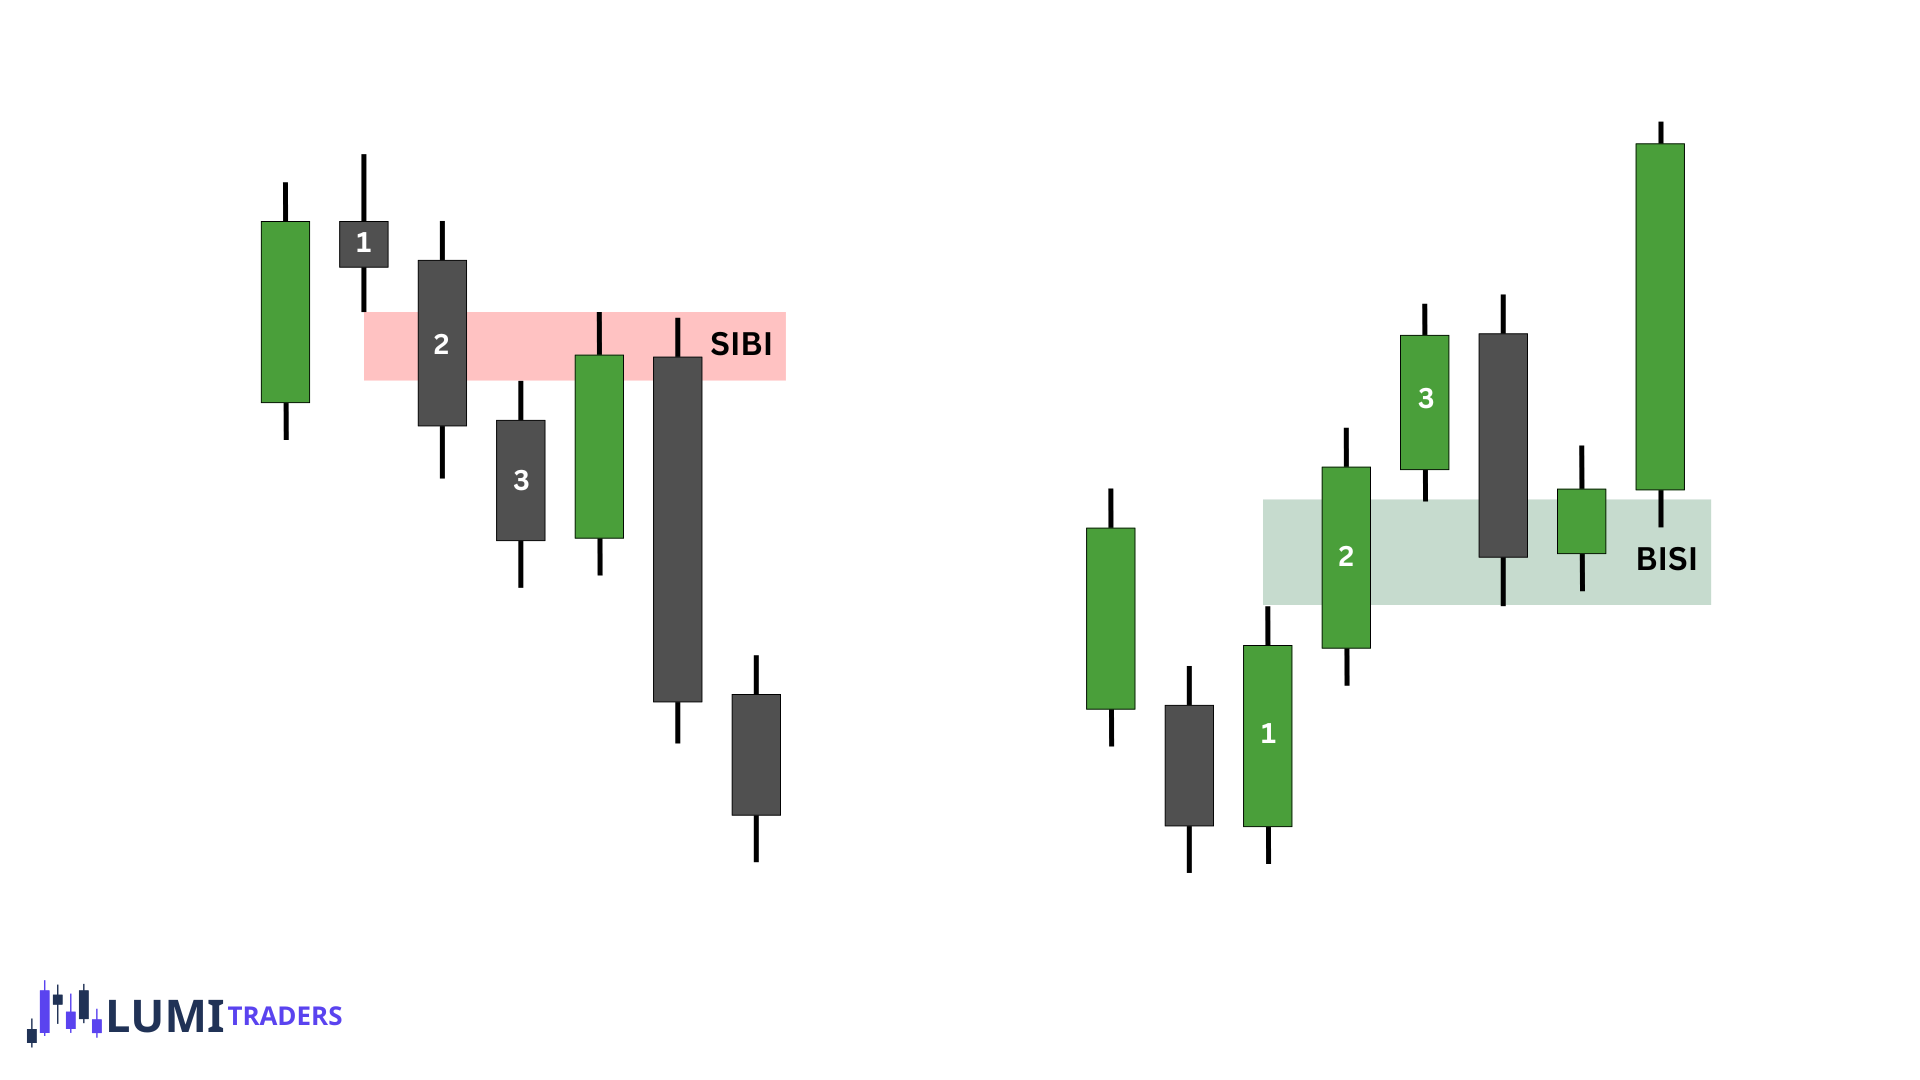
In a set of three candles, if the middle candle moves far enough, the third candle's low can end up above the first candle's high. The space between those two levels — candle 1's high and candle 3's low — is price that never got traded. That untouched space is the fair value gap (FVG).
Bearish version is the same thing upside down: candle 3's high sits below candle 1's low, and the space between them is the gap.
Because markets often seek to rebalance these inefficiencies, price frequently retraces to the Fair Value Gap before continuing in its original direction.
What Are BISI and SIBI?
BISI — Buy Side Imbalance, Sell Side Inefficiency. Forms during bullish movement. The buy side was offered, and the sell side was left inefficient. This is a bullish fair value gap: the third candle's low sits above the first candle's high, and the range between them is what got skipped.
SIBI — Sell Side Imbalance, Buy Side Inefficiency. Forms during bearish movement. The sell side was offered, and the buy side was left inefficient. This is a bearish fair value gap: the third candle's high sits below the first candle's low.
Three Types of Retest
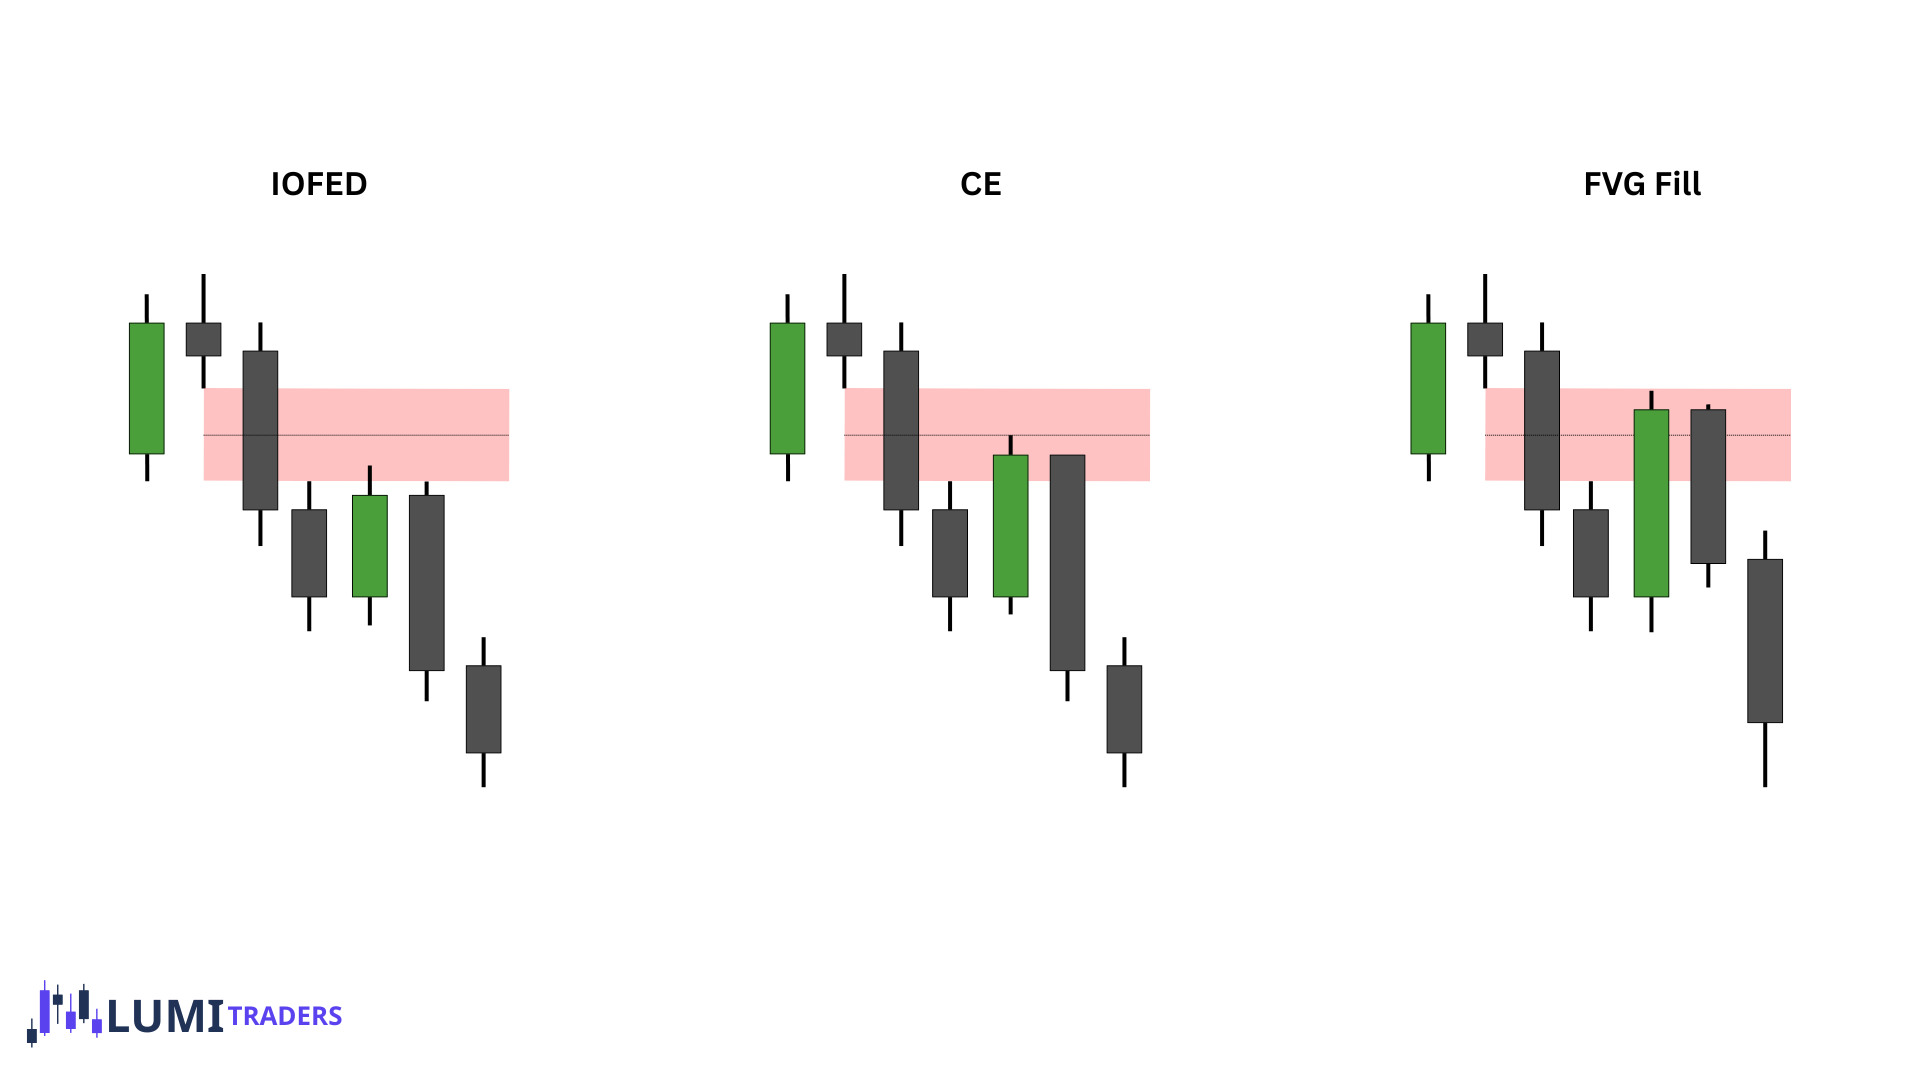
IOFED
Consequent Encroachment (50%)
FVG fill
IOFED - Institutional Order Flow Entry Drill
Price enters the FVG but does not cross its 50% midpoint - remaining below the midpoint for a bearish FVG and above the midpoint for a bullish FVG.
Consequent Encroachment (50%)
50% retracement level of a fair value gap.
FVG Fill
Complete fill is when price trades all the way through the gap, edge to edge. At that point the imbalance is fully rebalanced and ICT considers it spent - no longer a level worth watching. If price fills a bullish gap completely and keeps dropping, the setup has failed.
Breakaway Gap
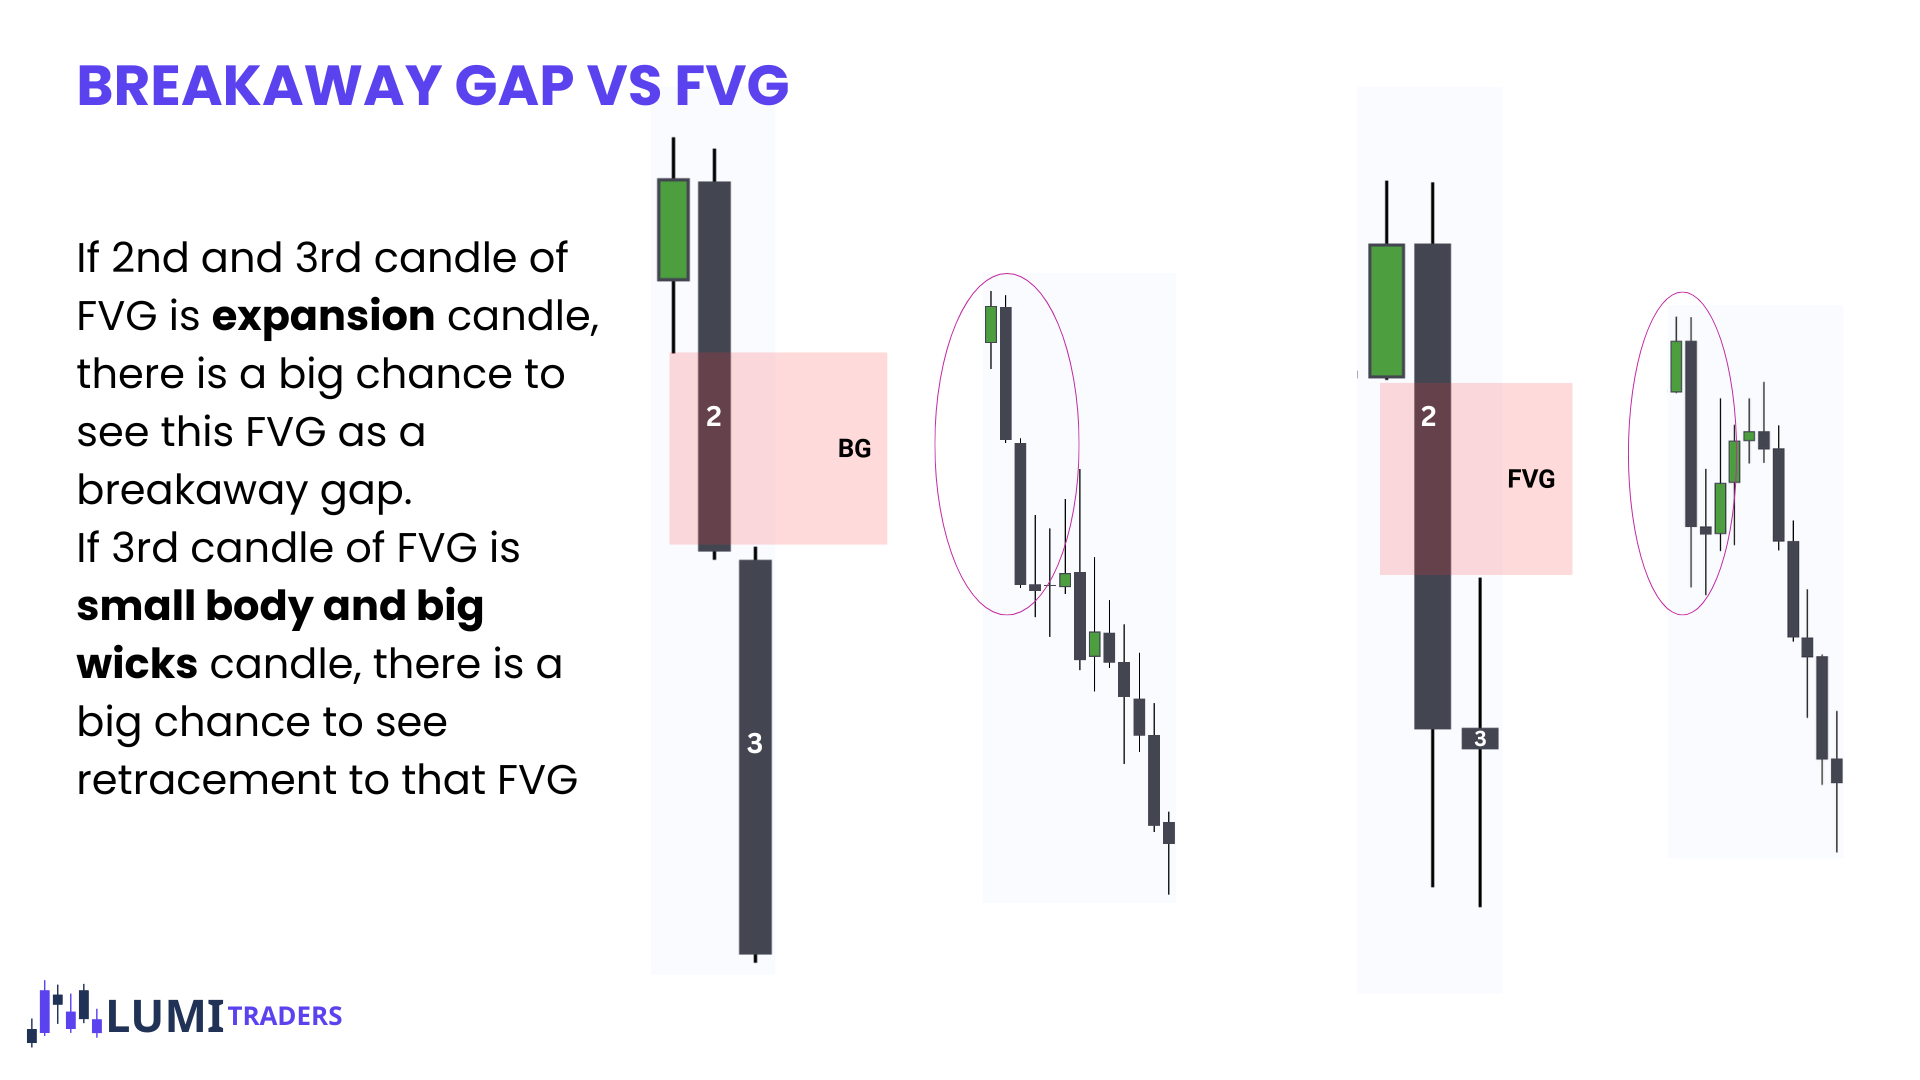
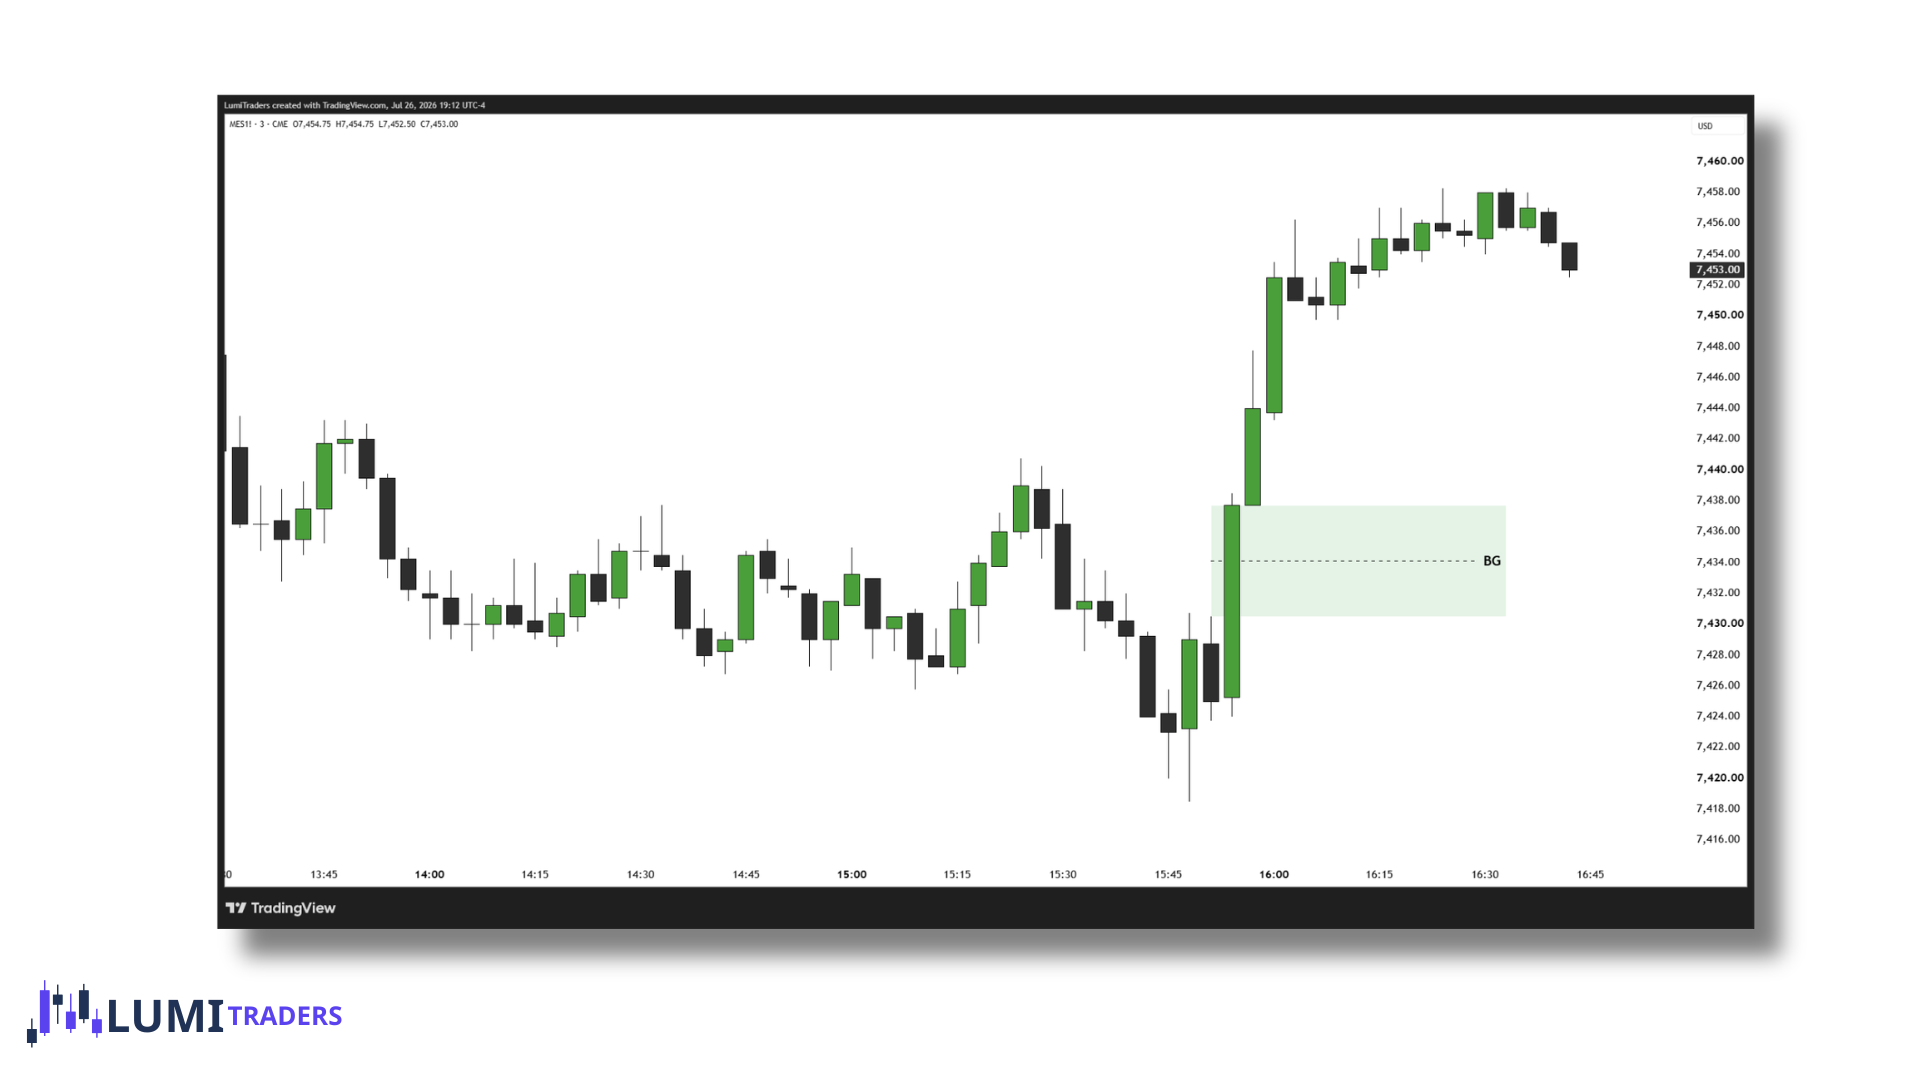
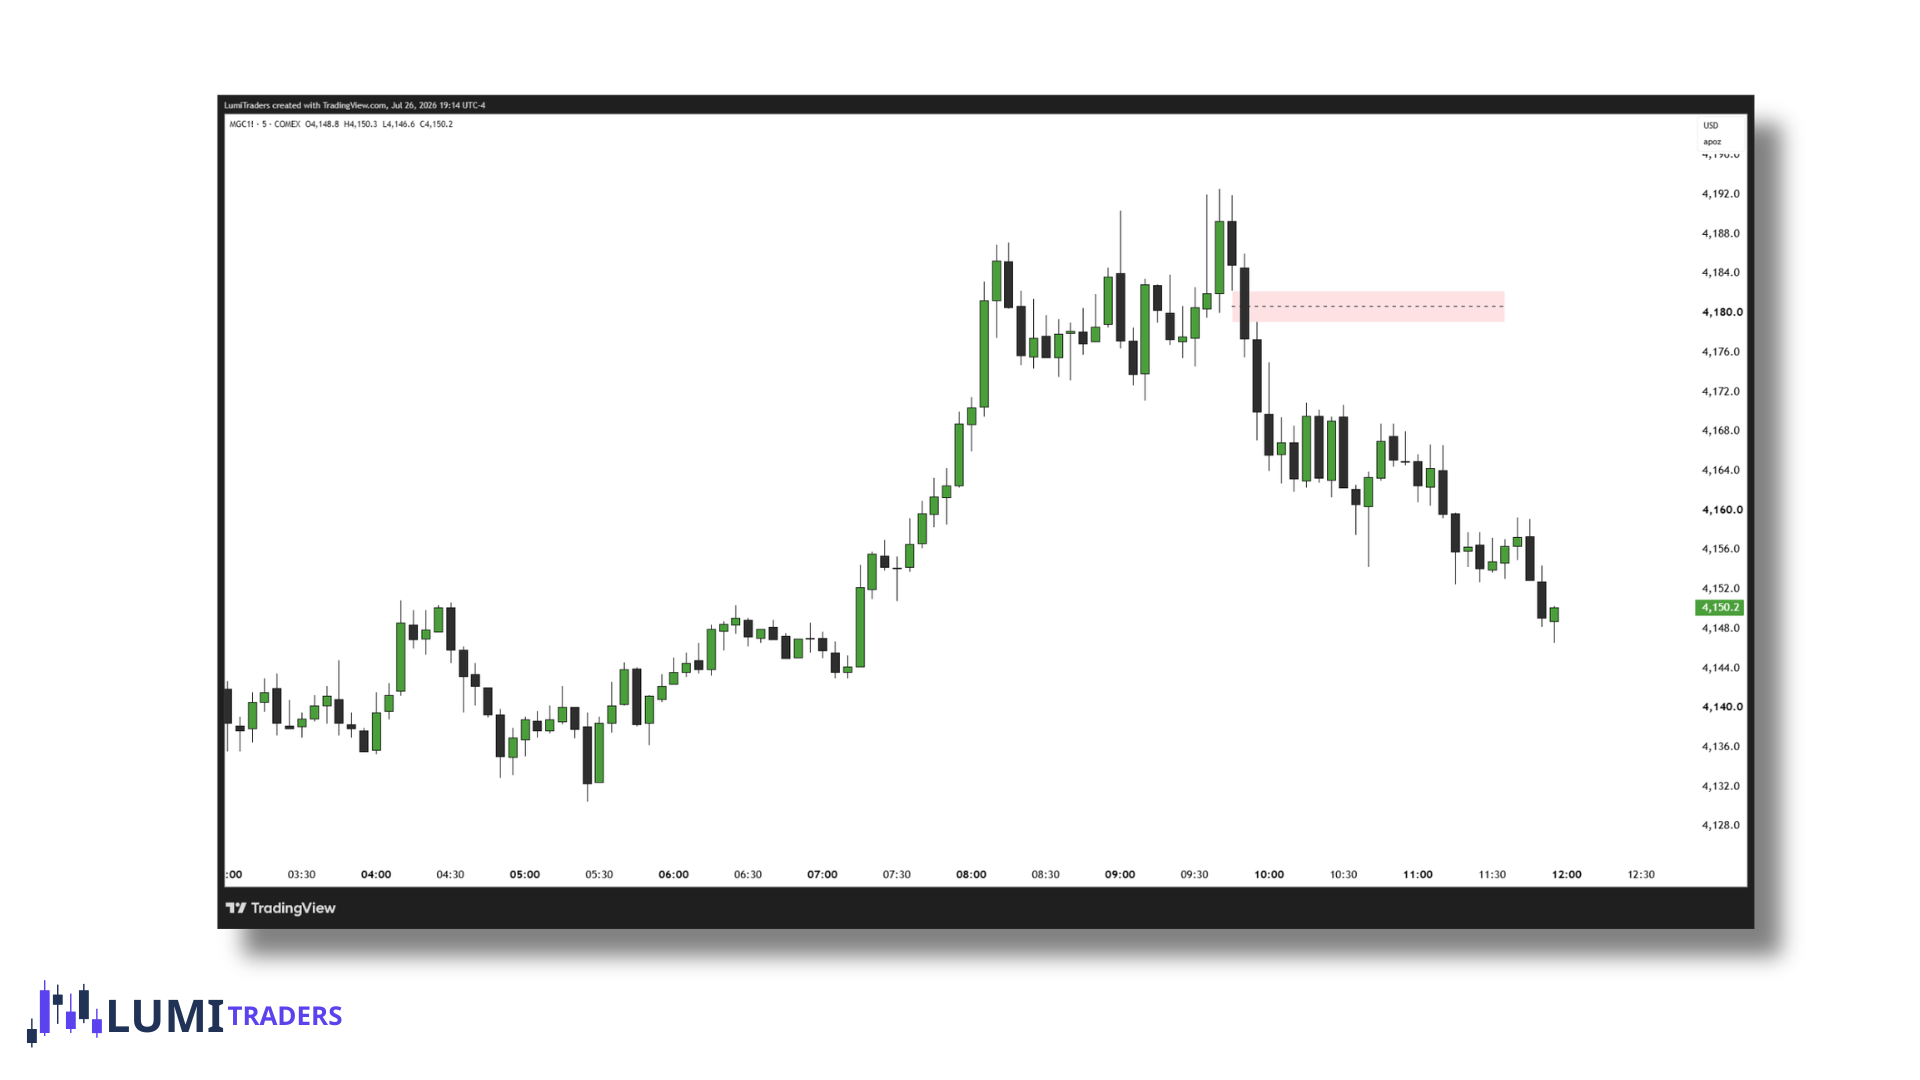
Breakaway Gap (BG) is a gap that forms at the start of a strong expansion - at the place where we expect to see SMR - smart money reversal - price breaking out of a range or consolidation and taking off. The defining characteristic is that price does not come back to this type of FVG. It runs away and leaves the gap unfilled, sometimes for a very long time.
The best way to identify a Breakaway Gap (BG) is by analyzing the formation of the Fair Value Gap (FVG).
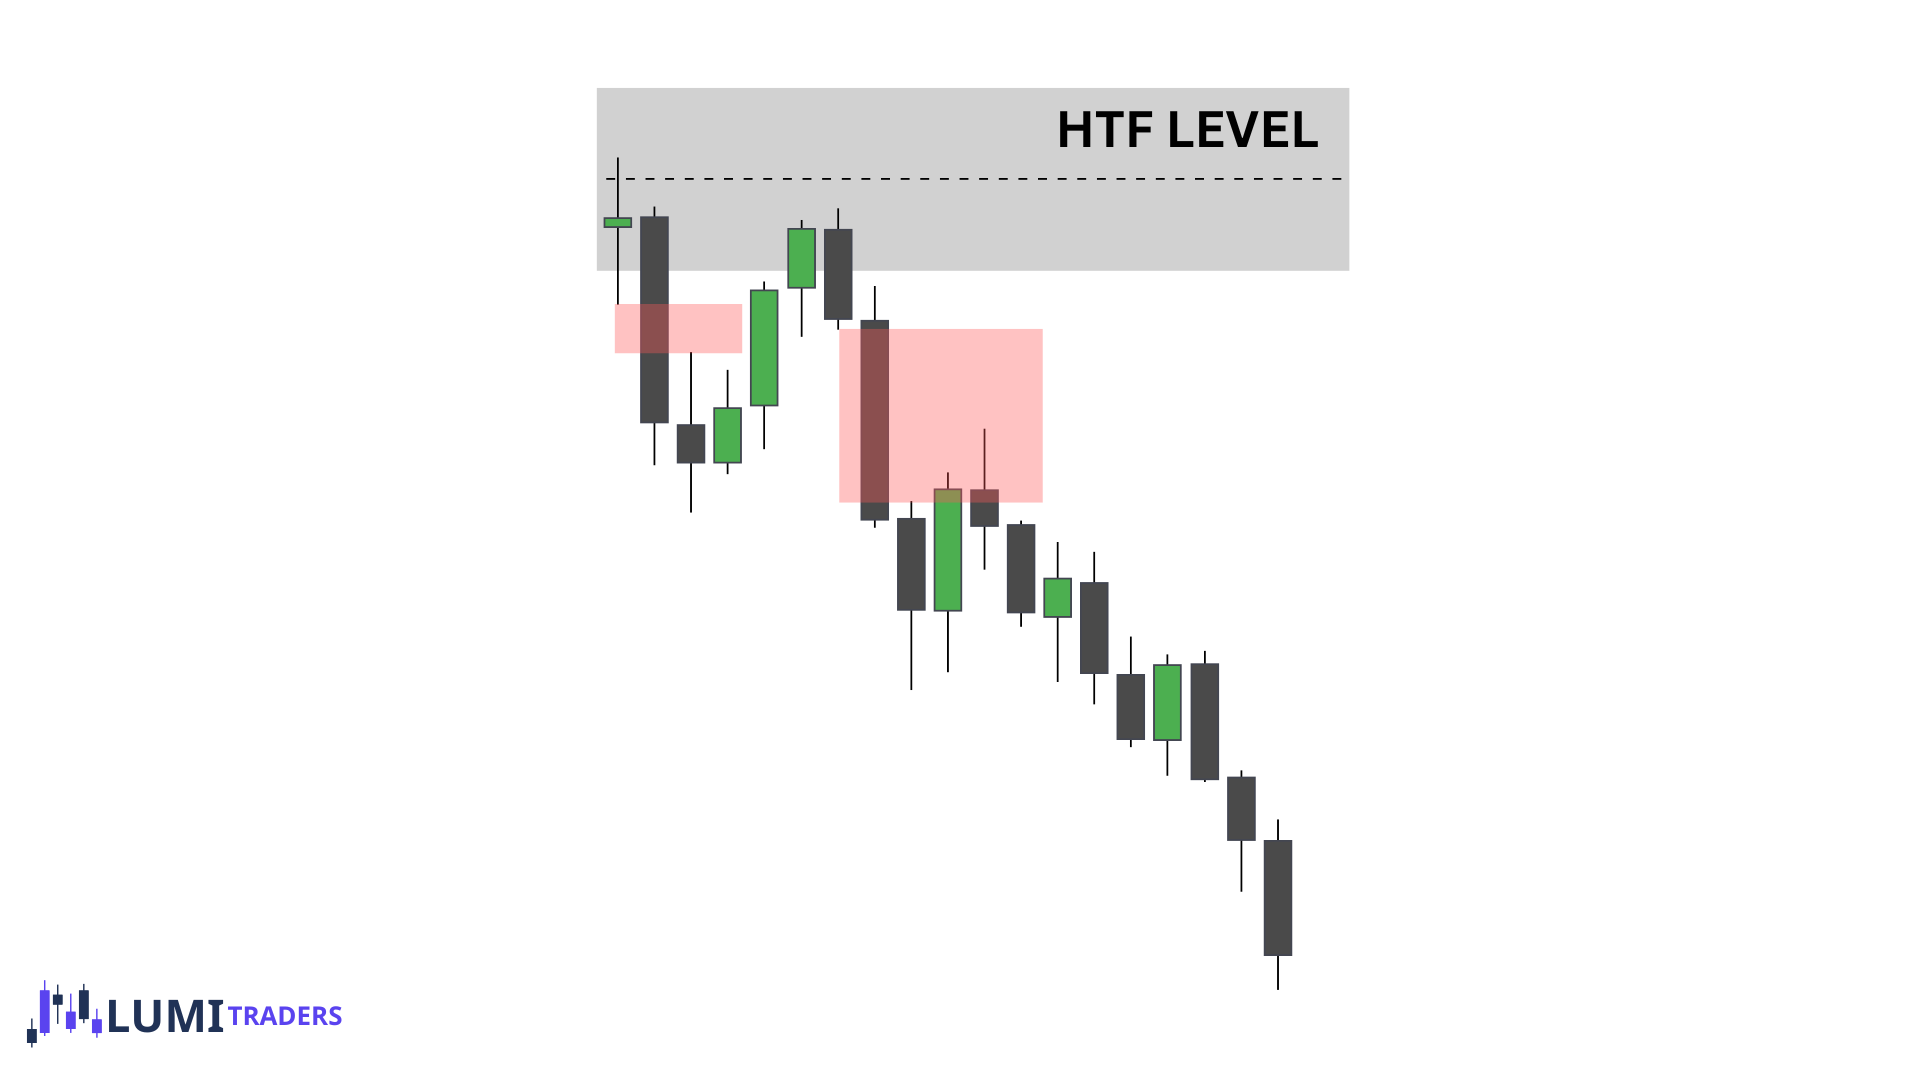
If the second and third candles that form the FVG are strong displacement candles, and the move originates from or taps a higher-timeframe (HTF) level, the FVG is much more likely to become a Breakaway Gap rather than a gap that gets retested quickly.
Measuring Gap
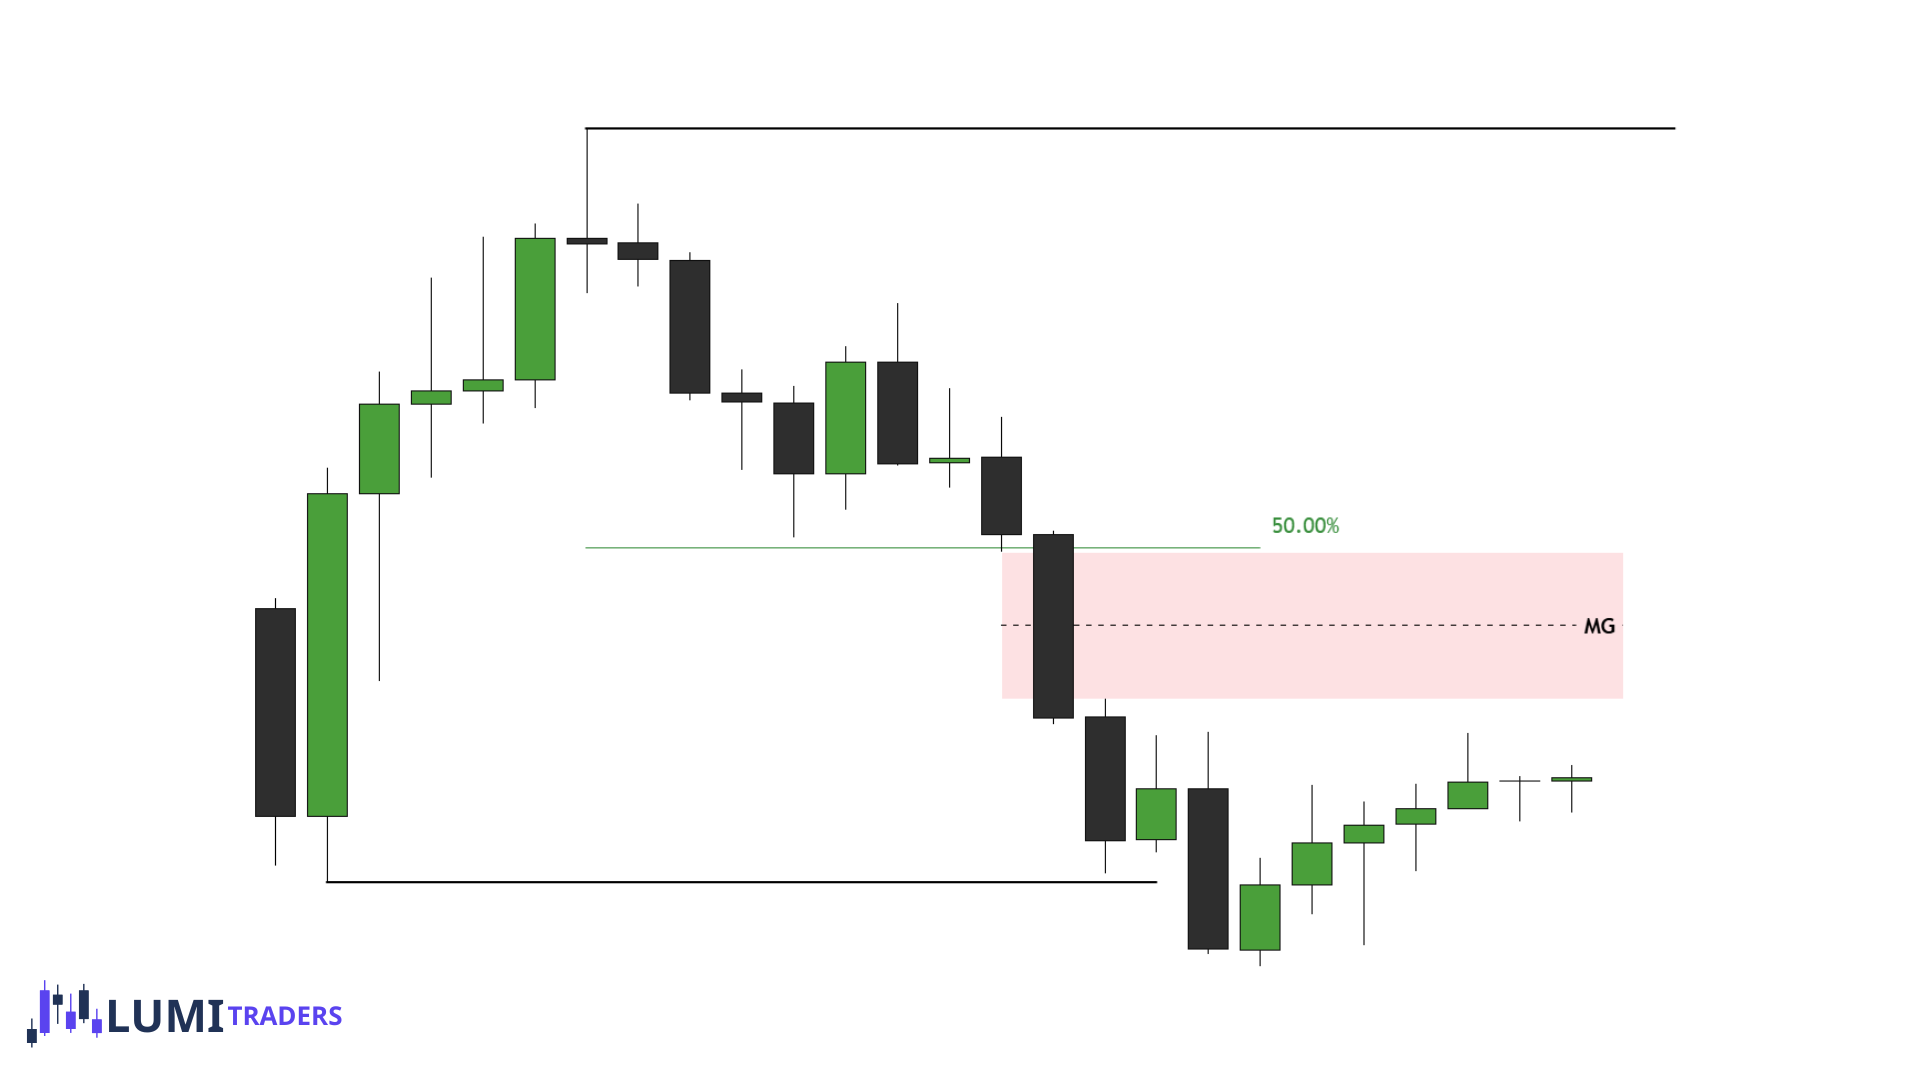
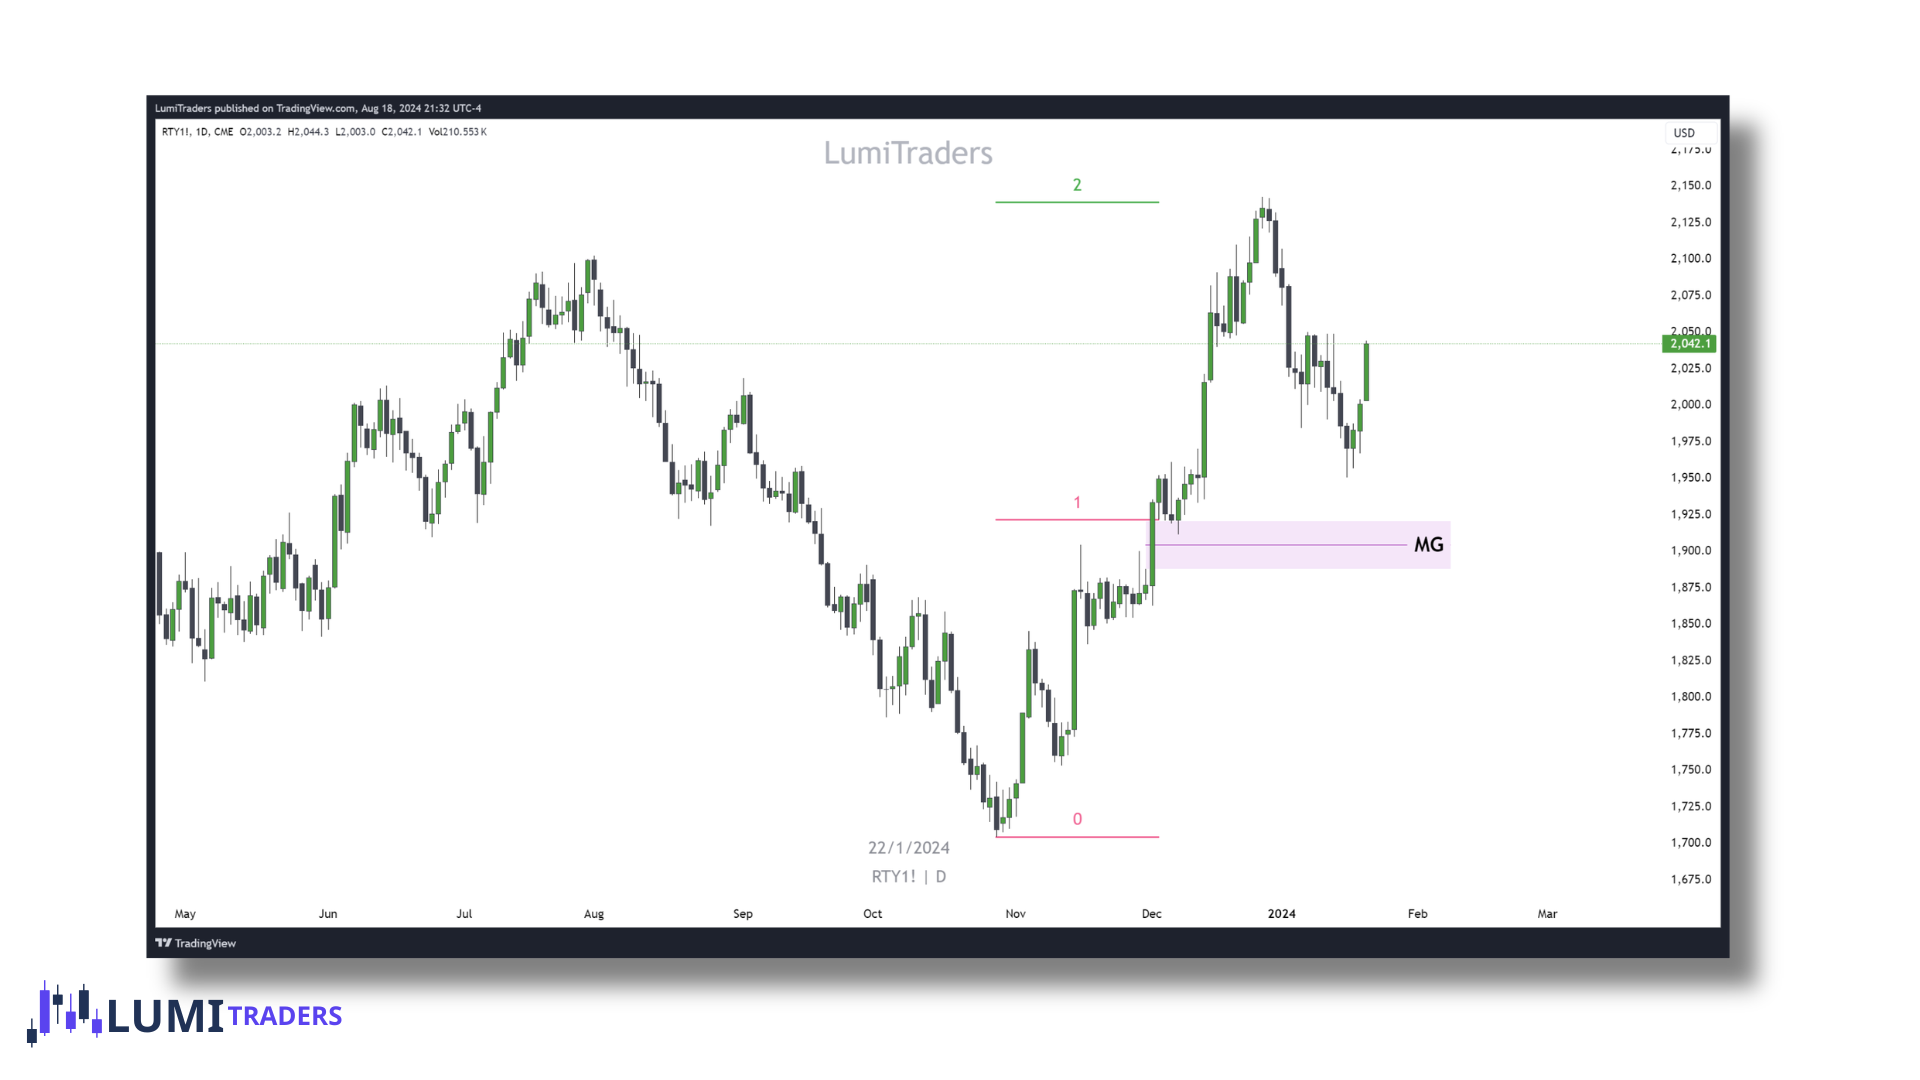
A Measuring Gap (MG) is a Fair Value Gap (FVG) that typically forms near the midpoint of an implied range. Unlike other types of gaps, a Measuring Gap often remains unfilled. When price does revisit it, the retracement is usually shallow, offering an IOFED (Institutional Order Flow Entry Drill) before continuing in the original direction to complete the formation of the implied range.
Measuring Gap signals that the current market trend is likely to continue.
How to Determine the Terminus Using a Measuring Gap
The Measuring Gap (MG) typically appears as a relatively large Fair Value Gap (FVG).
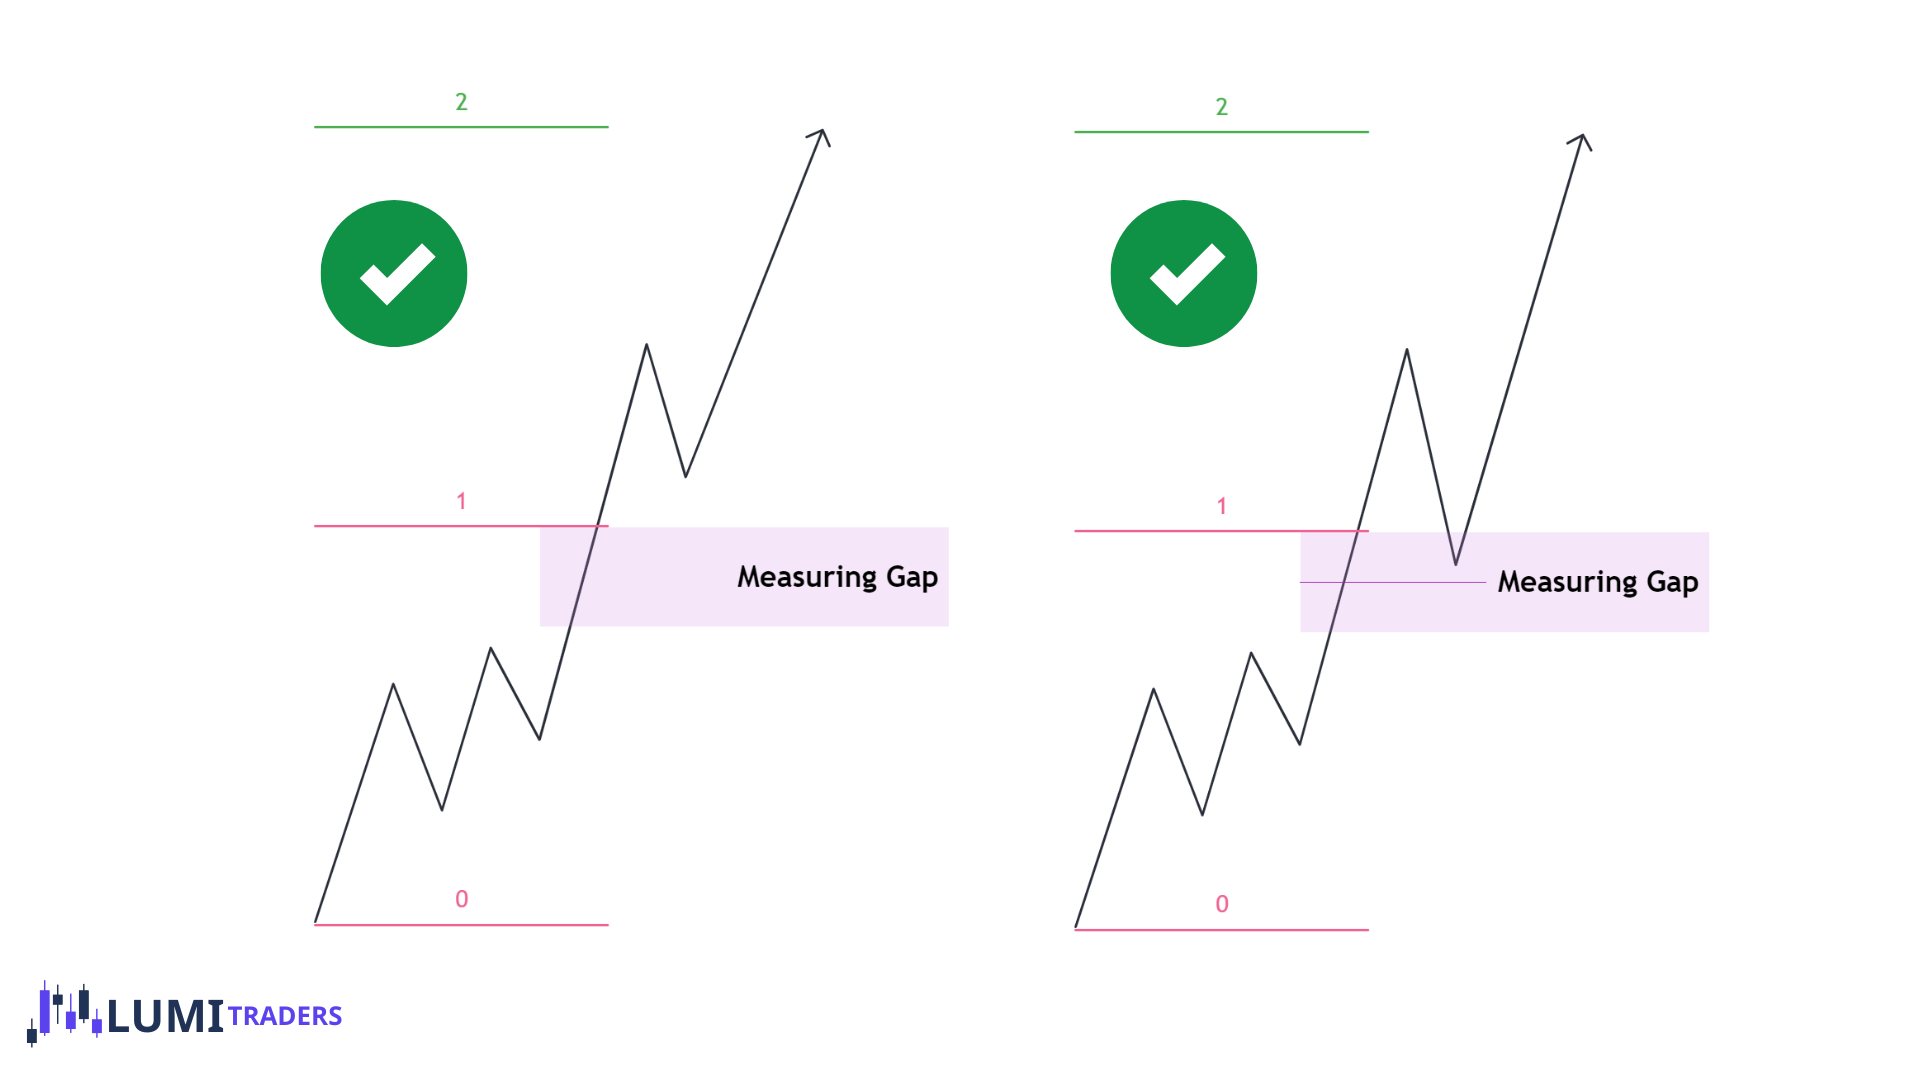
I generally use the projected move from the Measuring Gap as my MMXM target/terminus.
To reiterate, the Measuring Gap is the FVG located at the midpoint (50%) of the implied dealing range. /usually it forms during the second stage of re-accumulation or re-distribution.
To calculate the measuring move, I use:
The low/high where the SMR occurred, and
The top/bottom of the Measuring Gap.
Projecting this measurement by 100% provides my MMXM target.
Inversion FVG
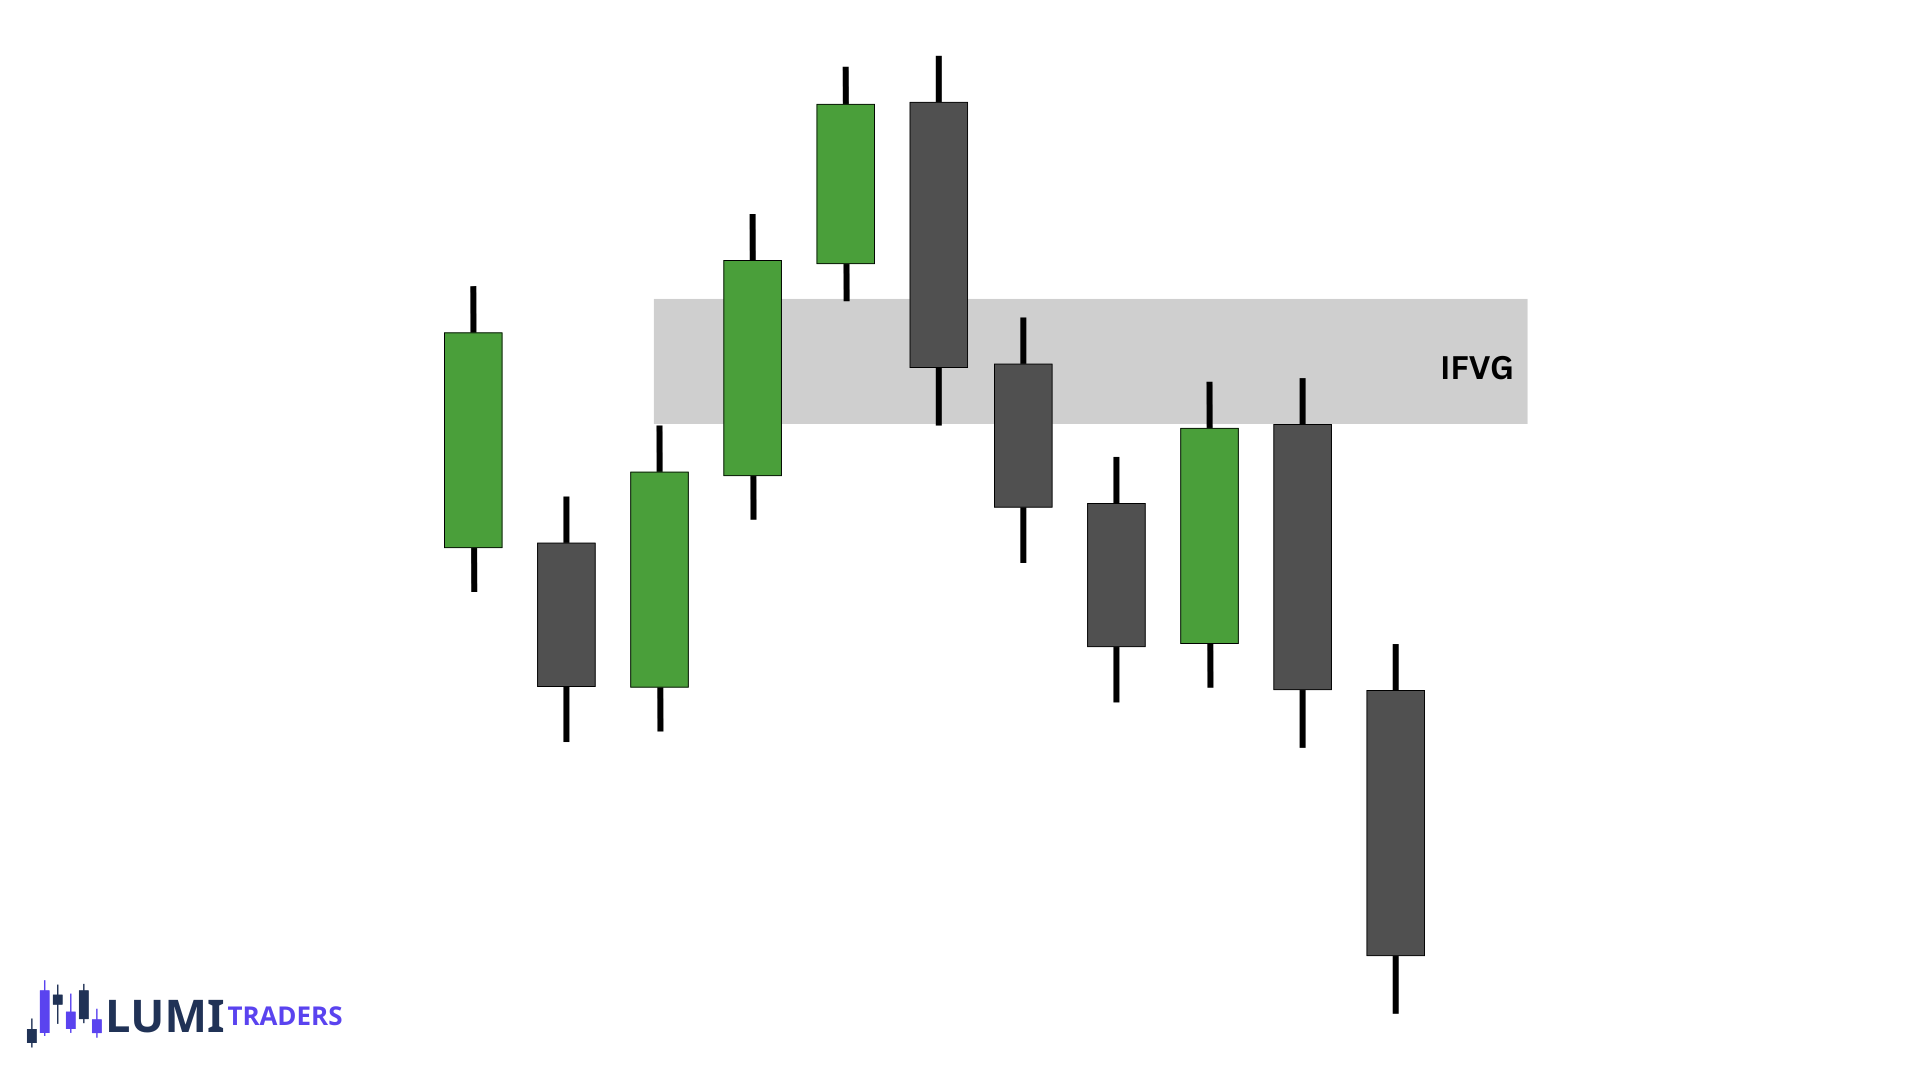
IFVG is a FVG that fails to hold and is violated becomes an IFVG, flipping its role from support to resistance or from resistance to support.
Bullish IFVG
A bullish FVG forms.
Price trades back down through the FVG.
Price closes below the FVG, showing the bullish FVG failed.
The FVG is now treated as a bearish IFVG.
When price returns to the IFVG, it can act as resistance.
Bullish FVG → violated to the downside → Bearish IFVG
Bearish IFVG
A bearish FVG forms.
Price trades up through the FVG.
Price closes above the FVG.
The FVG becomes a bullish IFVG.
When price returns to the IFVG, it can act as support.
Bearish FVG → violated to the upside → Bullish IFVG
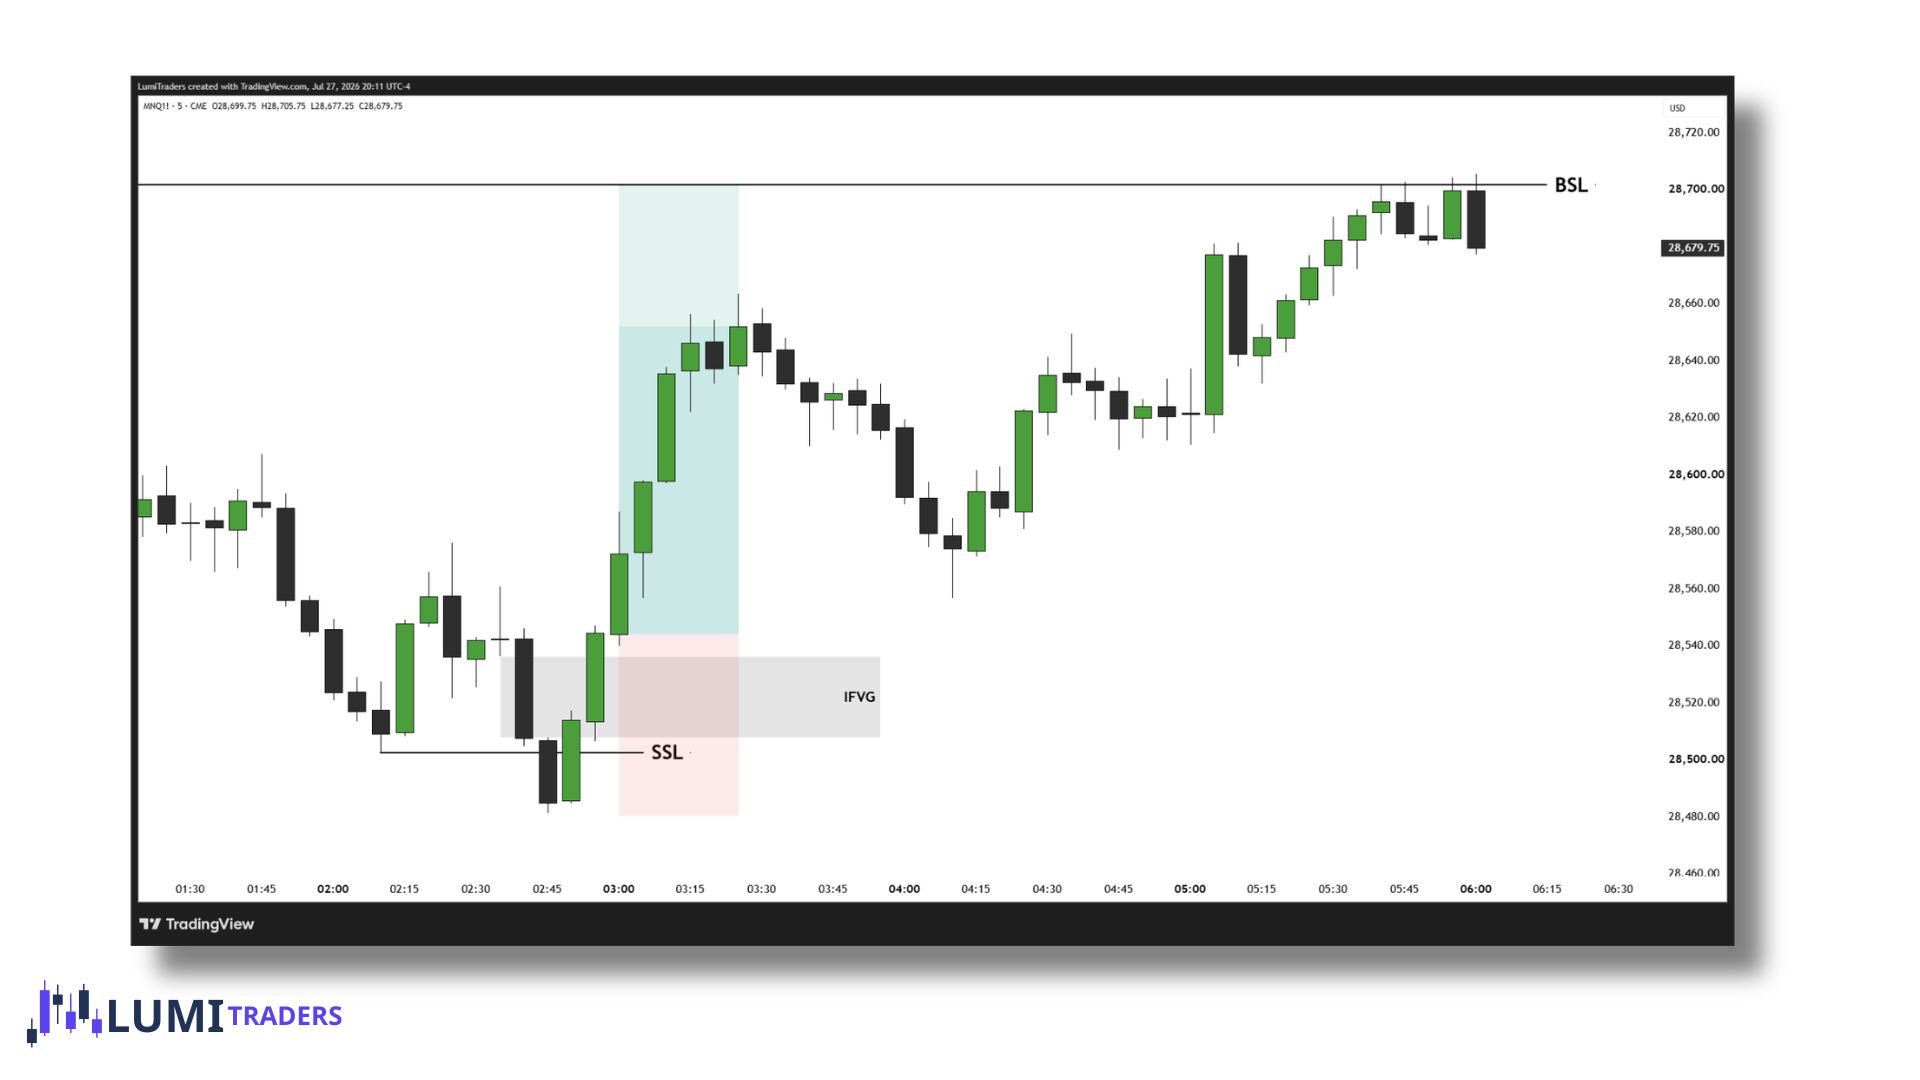
A+ IFVG conditions
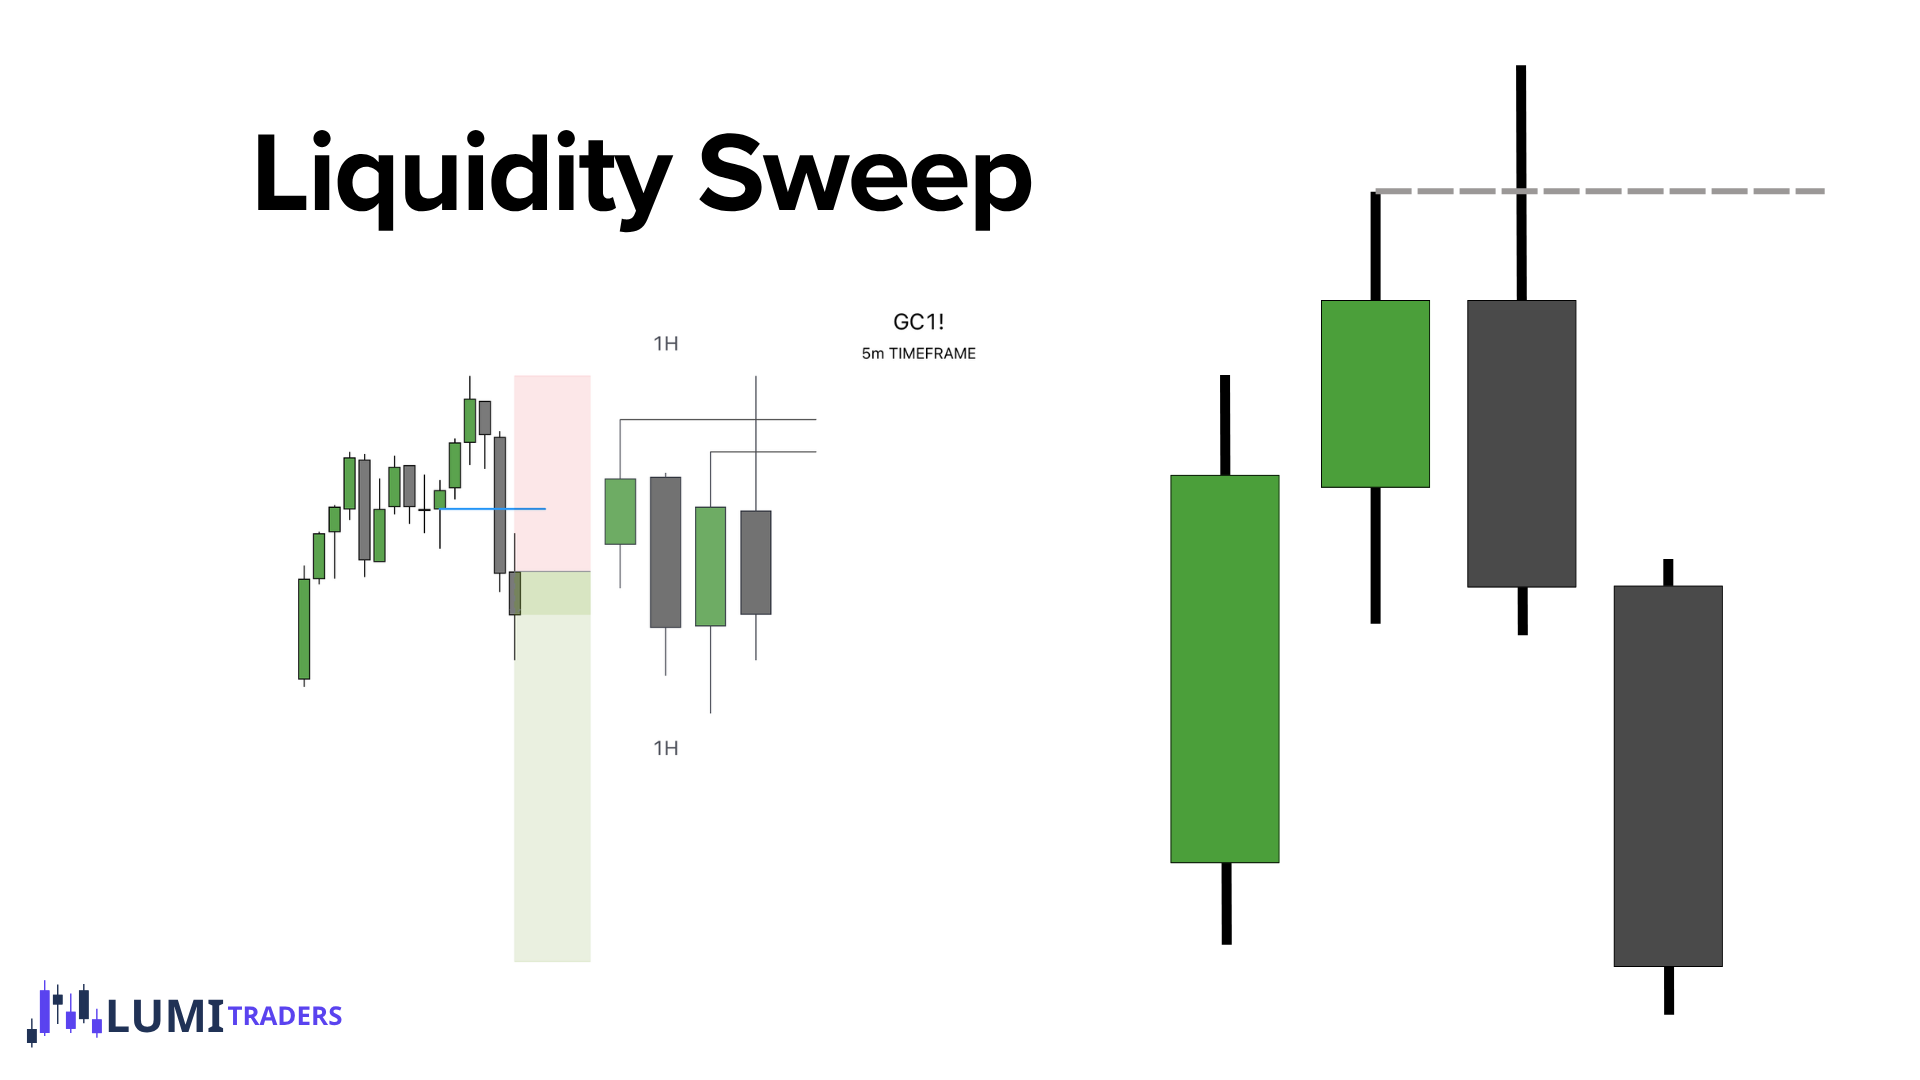
Liquidity Sweep
Displacement
Obvious Draw on Liquidity (EQH/EQL, News High/Low, etc.)
We want to short bearish IFVG in Premium and we want to long bullish IFVG in Discount
Balanced Price Range (BPR)
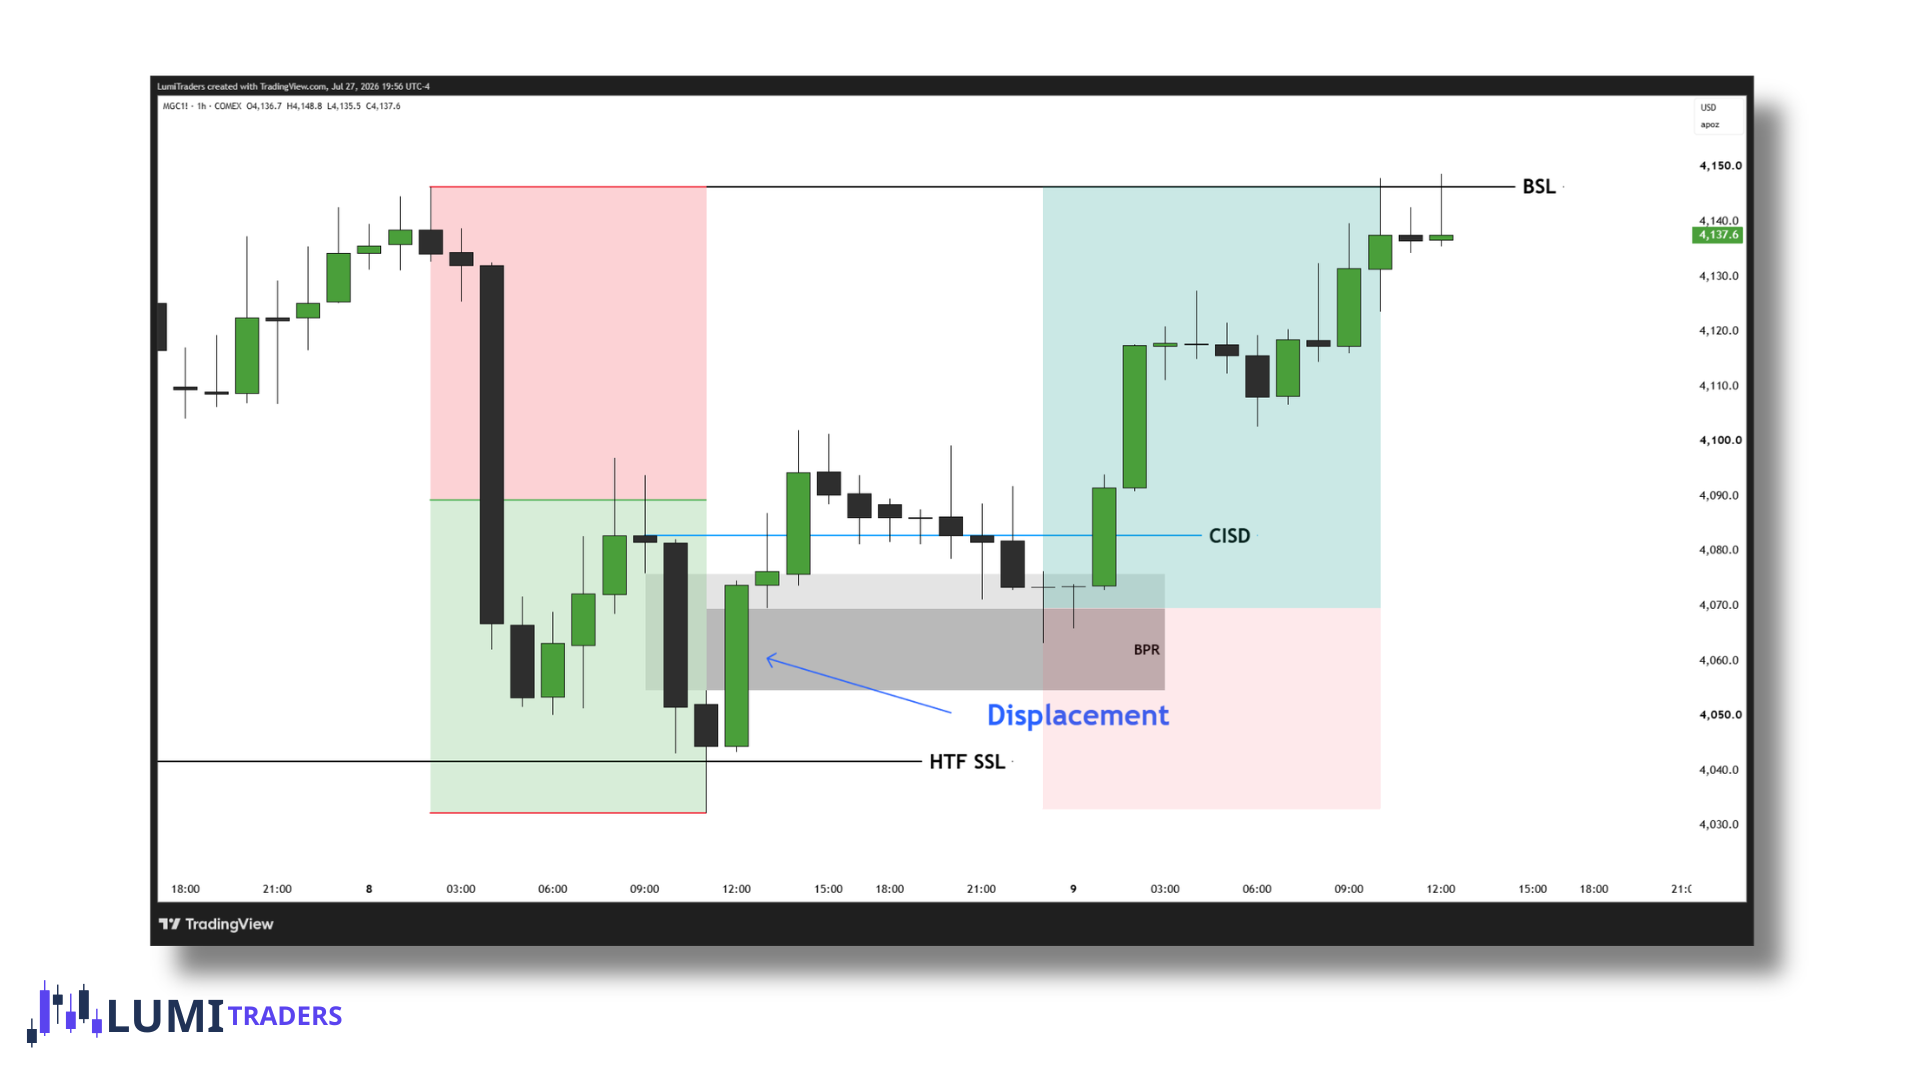
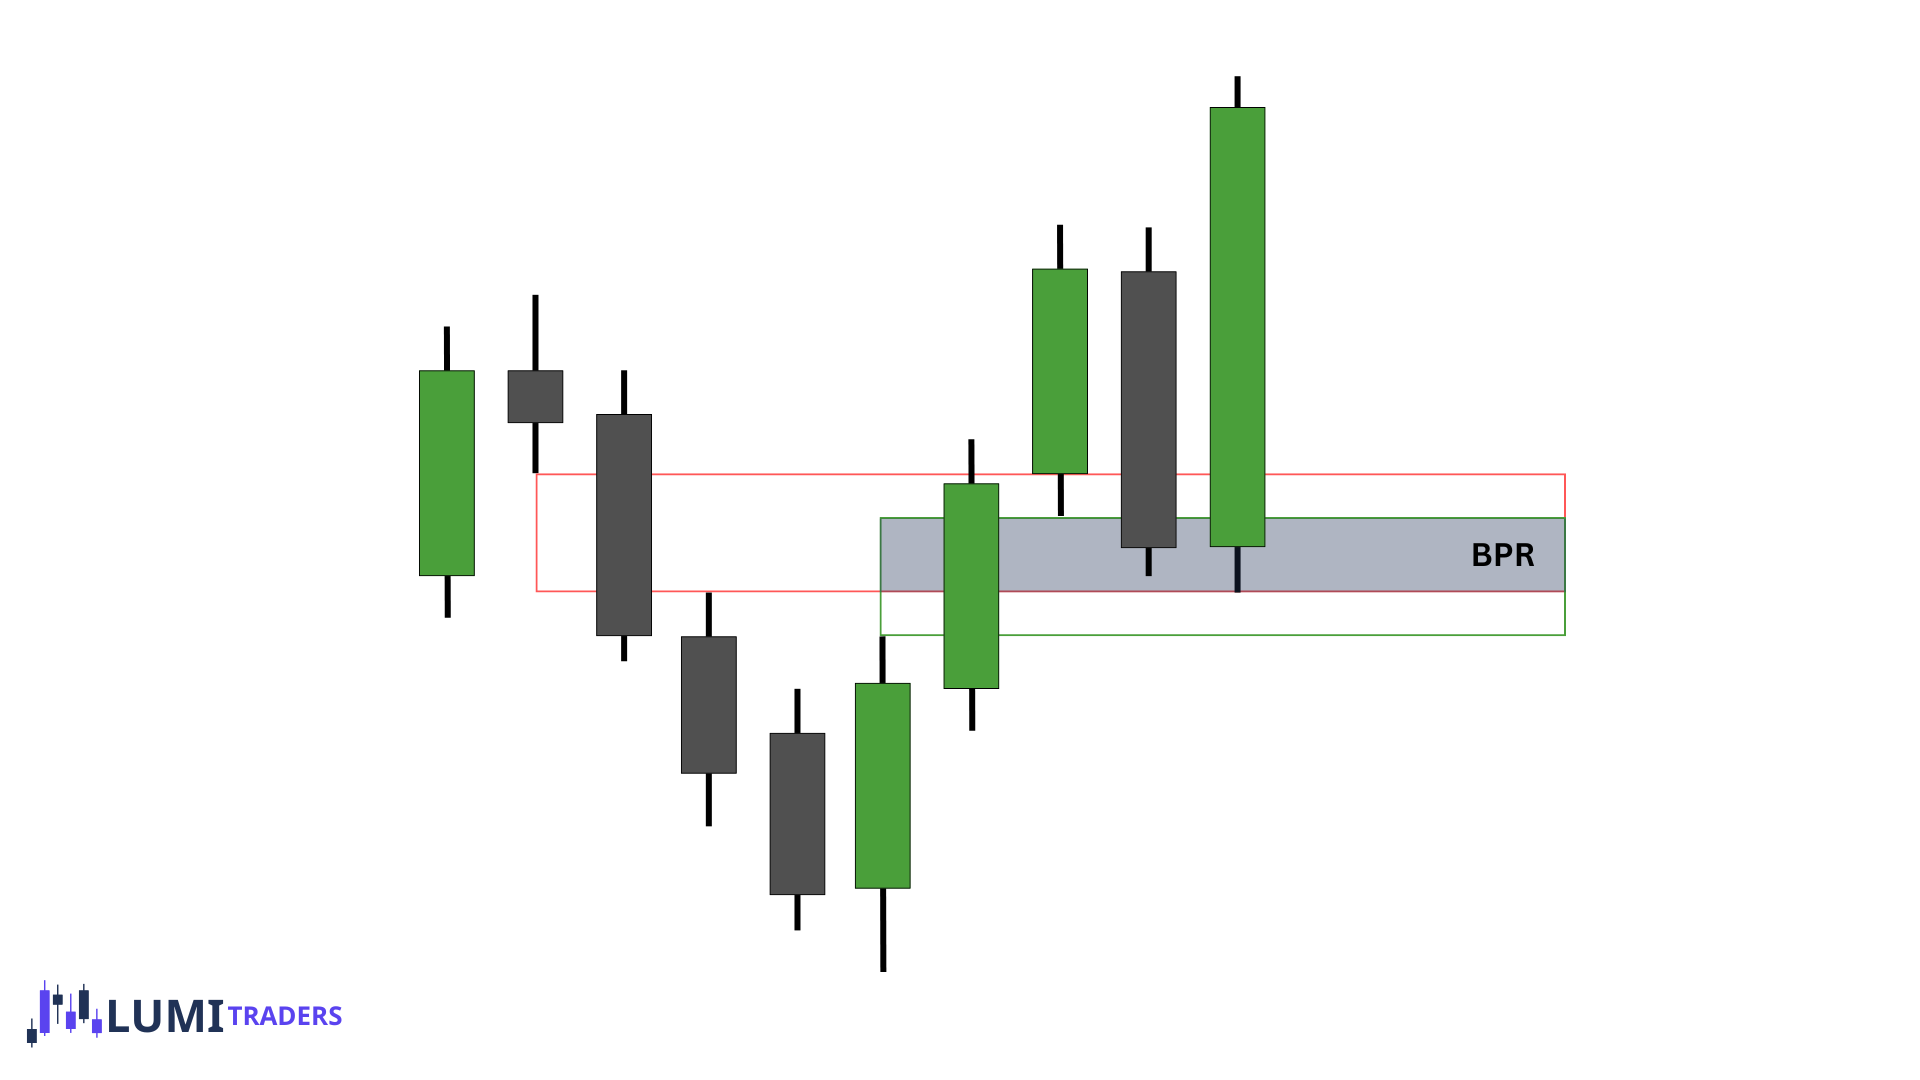
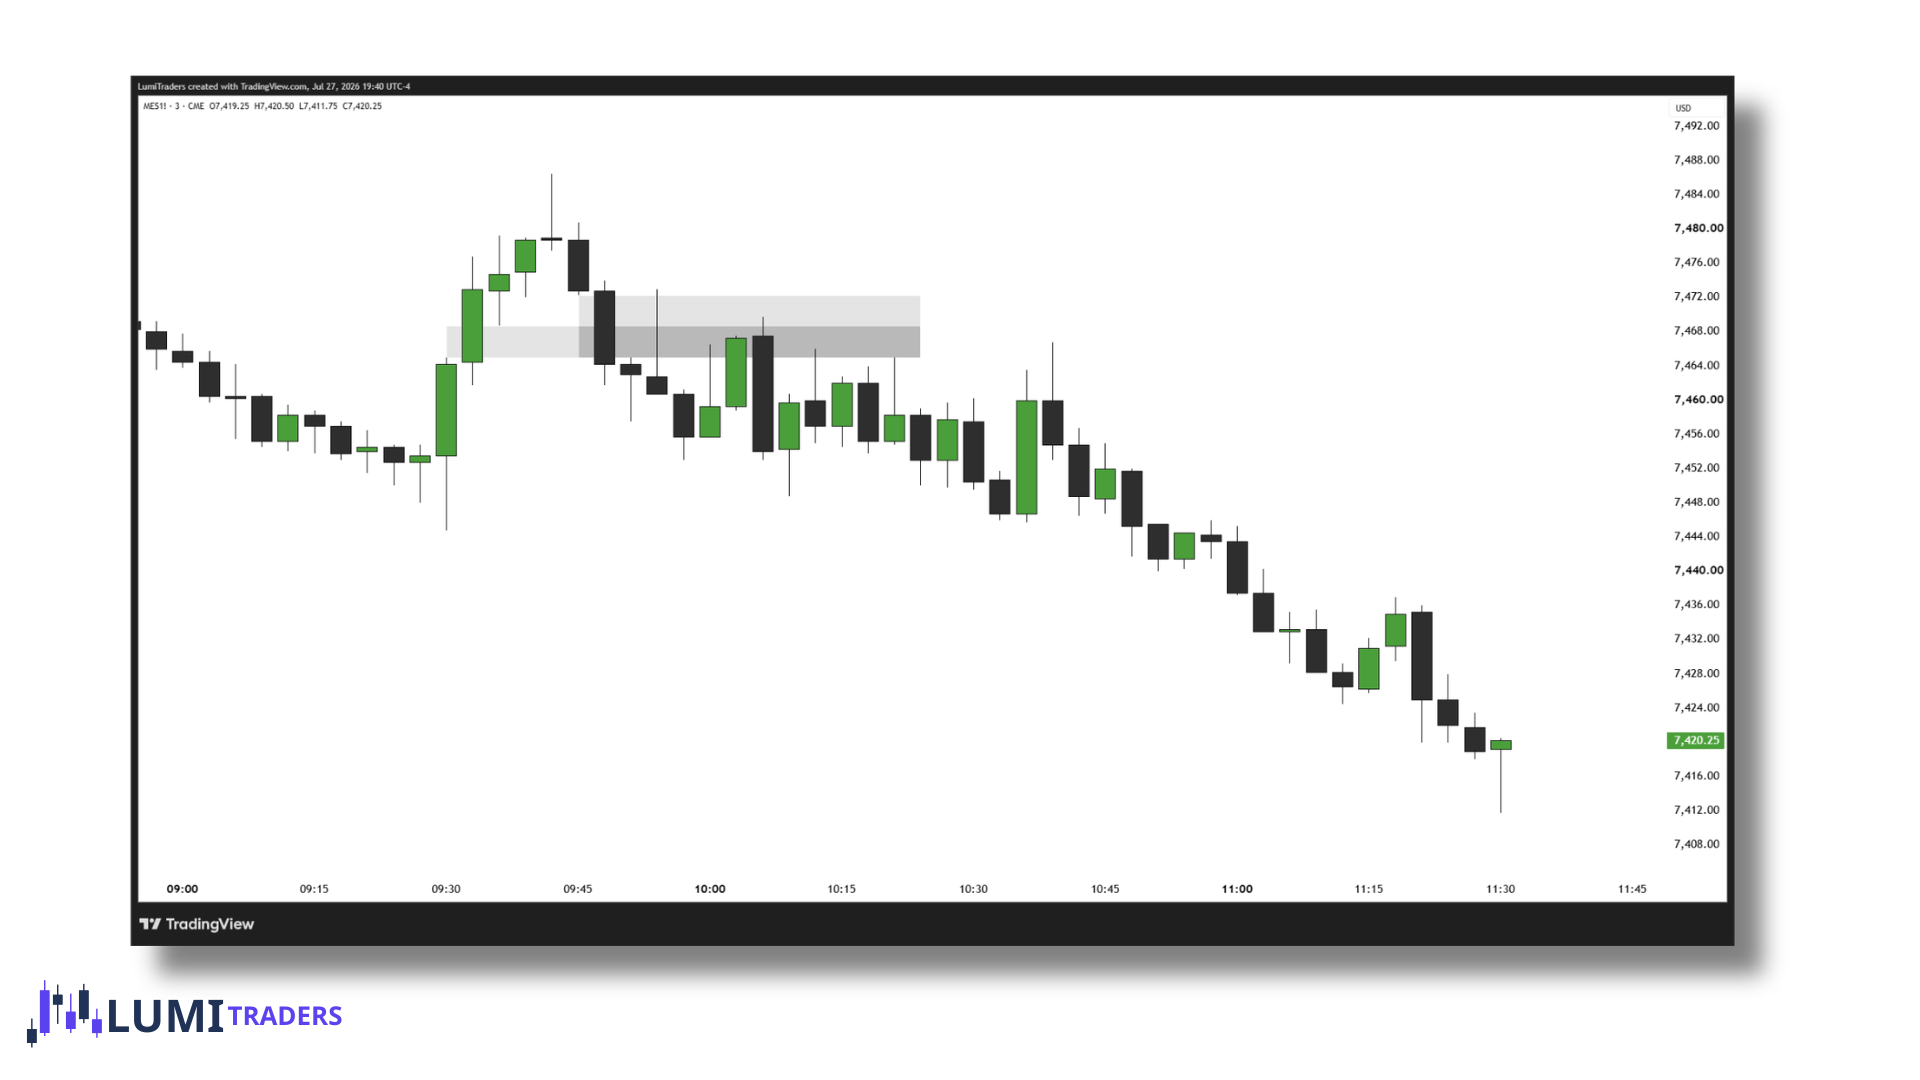
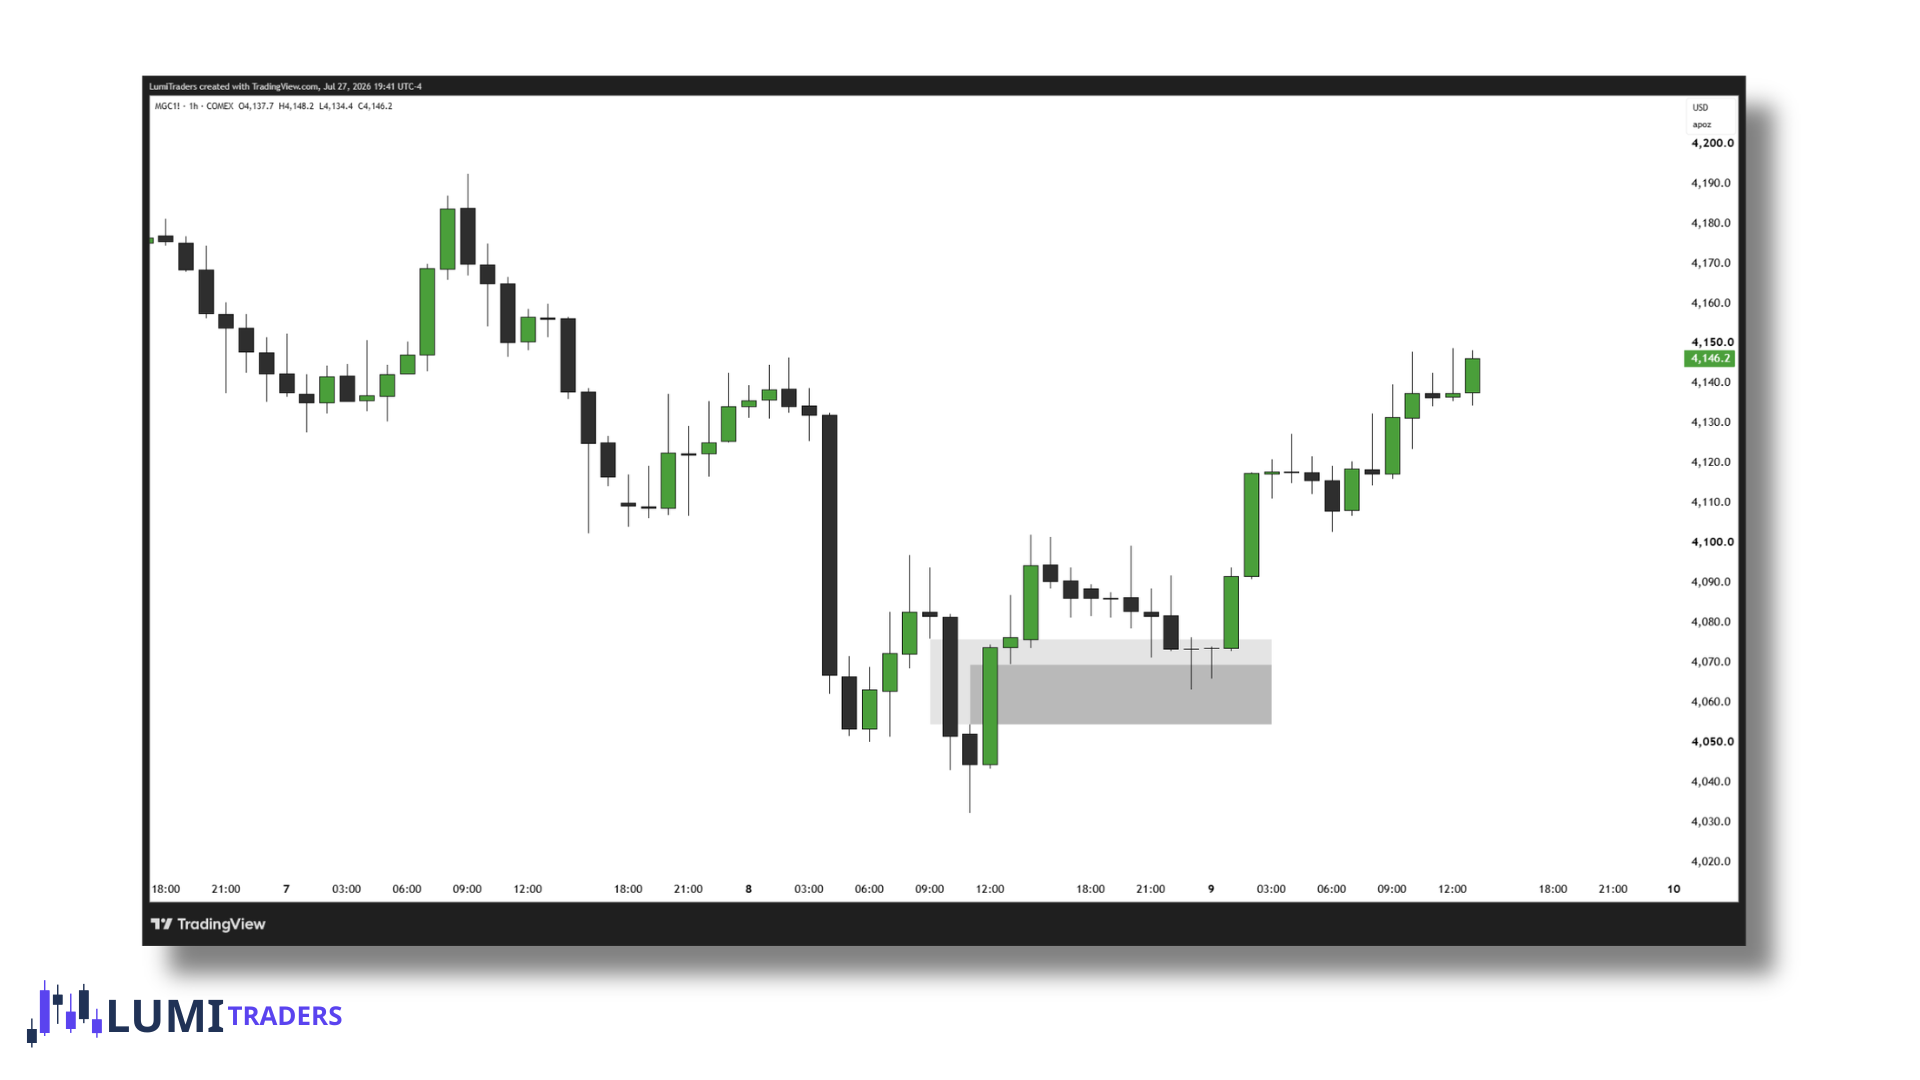
A BPR is created when two opposing Fair Value Gaps (FVGs) overlap or partially overlap. One FVG is typically bullish and the other bearish, creating a balanced area where price may react.
Simple example
Price moves down → creates a bearish FVG.
Price then reverses and moves up → creates a bullish FVG.
The two FVGs overlap → this overlapping area is the BPR.
Another words, BPR is a double FVG.
Why the Balanced Price Range Matters
The Balanced Price Range (BPR) matters because it can provide a key PD Array within the context of HTF narrative.
BPR is formed by opposing FVGs
The overlap between a Bullish FVG and a Bearish FVG creates the BPR.BPR can act as a reaction point
Price may return to the BPR to rebalance the inefficiency before continuing toward the next draw on liquidity.BPR can provide an entry model
When the BPR aligns with an HTF PD Array, CISD, MSS, or SMT, it can provide a more precise entry.BPR can confirm a shift in delivery
When formed around a CISD or MSS, the BPR can help identify the transition from one state of delivery to another. Basically, it confirms Smart Money Reversal.
BPR and displacement
You generally want to see meaningful displacement involved in the creation of the opposing imbalances.
The idea is not simply:
"Two random FVGs overlap."
Instead, you're looking for price delivery that creates an imbalance in one direction, followed by opposing delivery that creates an imbalance back through the same area.
The stronger the displacement and the more meaningful the context, the more interesting the BPR becomes.
This is why I would always ask:
Why did price displace?
What liquidity was taken?
What PD Array was involved?
Where is the BPR located relative to dealing range?
What is the HTF bias?
What is price likely seeking next?
The BPR itself is not the entire setup.
It is the location.
How I would trade a BPR
If I were building an ICT BPR model, I would structure it like this:
Step 1 — Establish HTF bias
Ask:
What is the Draw on Liquidity?
Is price seeking:
BSL? SSL? A specific HTF PD Array?
Step 2 — Establish Premium / Discount
Determine whether you're looking for:
Longs in Discount or Shorts in Premium
Step 3 — Wait for liquidity
Look for: BSL raid, SSL raid, EQH, EQL, PDH, PDL, PWH, PWL, Session liquidity level, killzone liquidity levels, etc.
The liquidity event gives you the narrative.
Step 4 — Look for displacement
You want to see the market demonstrate intent.
Look for:
Displacement, CISD, and/or MSS.
Step 5 — Identify the BPR
Now look for:
BISI overlapping SIBI or SIBI overlapping BISI. The overlapping section is your BPR.
Step 6 — Wait for retracement
Instead of chasing the displacement, allow price to return toward the BPR.
Step 7 — Enter
Your entry can be refined around:
BPR, FVG, IFVG, CISD.
Step 9 — Target liquidity
Your objective should be based on the Draw on Liquidity.
For example:
SSL → Bullish BPR → BSL or BSL → Bearish BPR → SSL